Exchange Ranking
 Top Exchanges
 24h Volume Ranking
 Popularity Ranking
 Exchange BTC Balance
 Proof of Reserves
 Decentralized Exchanges
 Funding Rate
 Funding Heatmap
 Liquidation Data
 Max Pain
 Long/Short Ratio
 Whale L/S Ratio
 Binance/Okex/Huobi L/S
 Bitfinex Margin L/S
 ETF Tracker
 Solana ETF
 XRP ETF
 Hong Kong ETF
 Bitcoin Treasuries
 Crypto Reversal
 Ethereum Reserves
 HyperLiquid Wallet Analysis
 Hyperliquid Whale Watch
 Large Transactions
 On-chain Movement
 Bitcoin ROI
 Stablecoin Market Cap
 Options Analysis
 News
 Articles
 Economic Calendar
 Features
 Wallet
 Contract Calculator


 Security
 Collections
 Watchlist
 Following
 BTC
比特币图表中出现一年多未见的强劲技术信号
比特币在价格结构上即将形成一年多来罕见的强力技术信号。BTC的50日、100日和200日移动平均线正在重新构建一个完整的上升排列,表明短期、中期和长期趋势同时向上。
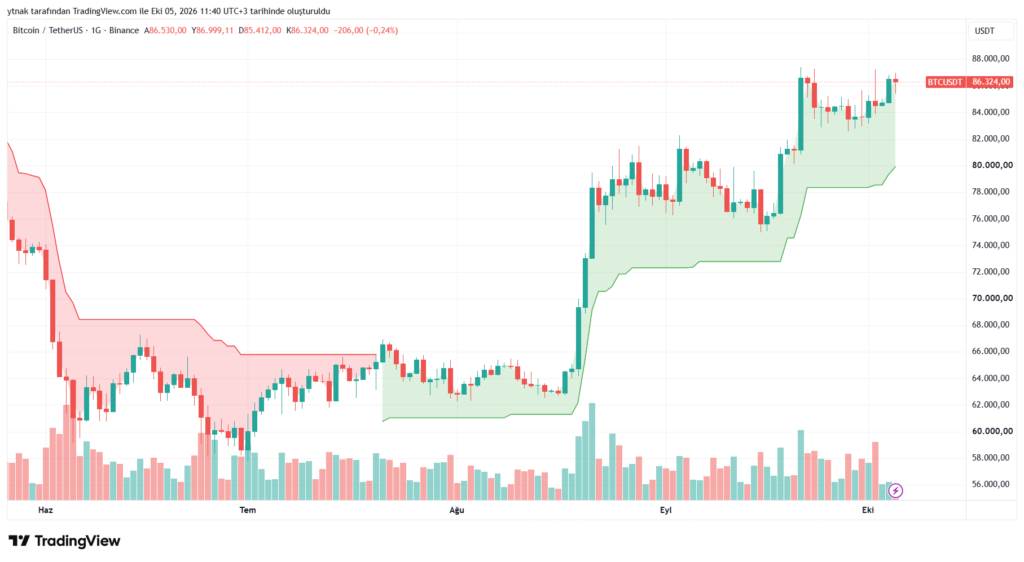
比特币在第三季度上涨超过40%,最高触及87,000美元,但近期价格在85,000美元附近盘整。目前市场关注的核心问题是:这一即将到来的技术信号是否会触发新一轮上涨浪潮。
比特币50日、100日和200日均线意味着什么?
要形成完整的上升排列,必须满足以下条件:50日均线上穿100日均线,且100日均线上穿200日均线。根据当前数据,比特币的50日简单移动平均线约为79,495美元,位于其他两条均线之上;100日均线约为79,493美元,而200日均线约为79,539美元。
因此,一旦100日均线上穿200日均线,均线排序将变为“50日 > 100日 > 200日”,这将是自2025年以来首次出现的全方位上升排列。Giottus首席执行官Vikram Subburaj指出,此次交叉是自2025年6月24日形成的上一次排列以来首次重现。
为何该信号至关重要?
Moving averages are used to evaluate price trends in different time dimensions. When the short-term moving average crosses the long-term moving average, it indicates that recent price momentum is stronger than historical levels. According to Subburaj's analysis, the upcoming cross signal supports the sustainability of Bitcoin's rebound over the past three months. But he also highlighted an important warning: this ranking alone does not guarantee that the upward trend will continue.
Bitcoin's behavior after this signal appears will determine whether the technical side truly translates into a lasting bull market structure.
What happened after similar signals appeared in history?
Past cases show that this form of technology does not always bring the same results.
- October 27, 2020: The rising ranking starts at approximately US$13,600 and continues until May 2021. In the end, BTC broke through US$64,000, setting a record high at that time.
- November 2023: This ranking continues until May 2024, during which time Bitcoin rose from approximately US$35,000 to US$73,000.
- June 2025: ranked for 97 days, but the increase was small, only rising from approximately US$106,000 to US$112,000.
- June 2024: A similar structure only lasted for 20 days, before BTC fell by about 10%.
It can be seen that the emergence of new signals is not enough in itself to ensure a rise. Historical data shows that the price response after a crossover is more critical.
Can Bitcoin remain above its 50-day moving average?
Subburaj指出的最重要测试点是:信号形成后,比特币能否站稳50日均线之上。目前该均线位于约79,495美元。若比特币在回调中守住这一区域,则技术反弹的强度得以保留。
反之,若跌破50日均线,则可能表明预期的上升排列未能对市场产生足够影响。因此,技术分析不仅关注交叉的发生,更重视后续价格对该均线的反应。
比特币是否已准备好迎接新一轮上涨?
比特币在第三季度大涨超40%,触及87,000美元,近期受美元走强影响,在85,000美元附近企稳。即将到来的50-100-200日均线排列暗示此次反弹有望转化为更坚实的技术结构。然而,鉴于历史上该信号既出现在大幅拉升前,也曾伴随短暂行情,单凭交叉无法断定新牛市启动。
未来一段时间的关键在于:50日均线的坚守以及价格行为对新排列的确认。
本文内容基于一般市场数据,不构成投资建议。建议读者进行独立研究。