Exchange Ranking
 Top Exchanges
 24h Volume Ranking
 Popularity Ranking
 Exchange BTC Balance
 Proof of Reserves
 Decentralized Exchanges
 Funding Rate
 Funding Heatmap
 Liquidation Data
 Max Pain
 Long/Short Ratio
 Whale L/S Ratio
 Binance/Okex/Huobi L/S
 Bitfinex Margin L/S
 ETF Tracker
 Solana ETF
 XRP ETF
 Hong Kong ETF
 Bitcoin Treasuries
 Crypto Reversal
 Ethereum Reserves
 HyperLiquid Wallet Analysis
 Hyperliquid Whale Watch
 Large Transactions
 On-chain Movement
 Bitcoin ROI
 Stablecoin Market Cap
 Options Analysis
 News
News Articles
 Economic Calendar
 Features
 Wallet
 Contract Calculator


 Security
 Collections
 Watchlist
 Following
 GNO
GNO Gnosis quietly became one of the most noteworthy charts this week, not just because of price. $GNO broke through the wedge shape that lasted for several weeks with a strong positive line. After two days of consolidation, it is currently hovering below the resistance level.
Meanwhile, GnosisDAO has just passed a quorum on a proposal to reduce the total supply of tokens to 3 million, a token economics adjustment that coincides with the trend already being shown in the chart itself. This Gnosis price forecast will be analyzed through on-chain contract data.
What does the GNO token contract and governance update reveal?
On-chain data from the GNO token contract shows that the maximum total supply on Gnosis Chain is 10,000,000 $GNO, the number of holders is 20,179, and the current price is US$120.65, corresponding to 0.051199 ETH. 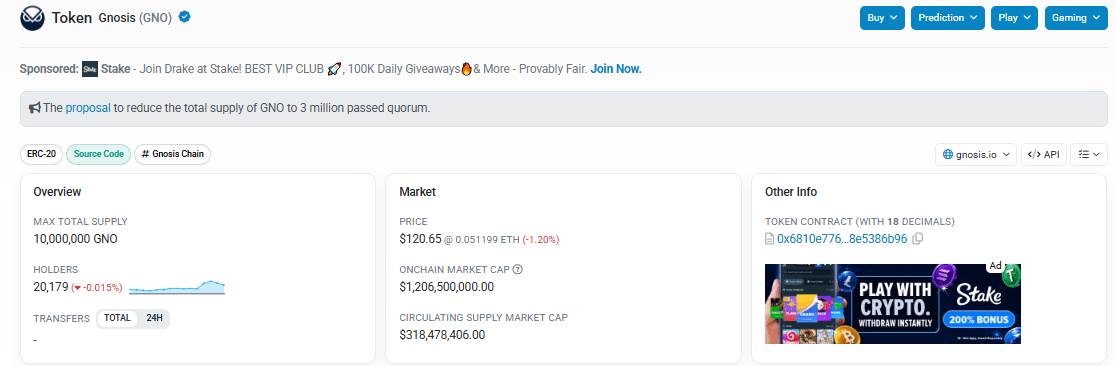 The listed value of the chain based on this theoretical maximum supply is approximately US$1.2065 billion, while the market value in circulation is much lower at US$318,478406 million-a gap that will gradually narrow as the tokens are destroyed.
This gap is why recent governance developments are crucial to this GNO price forecast : a proposal to reduce the total supply to 3 million $GNO has passed the quorum, and the current total supply is close to that target.
What information does CoinMarketCap data currently reveal about GNO?
CoinMarketCap data shows that GNOThe trading price was $120.95, down 0.74% in the past 24 hours, and the market value fell 0.71% to $319.25 million. 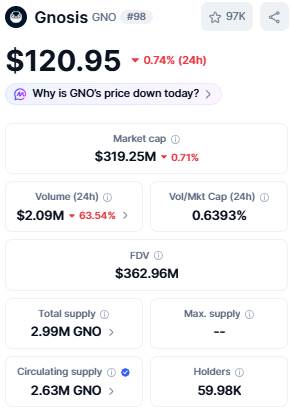 Trading volume showed a different trend, plummeting 63.54% to only US$2.09 million, and the ratio of trading volume to market value was 0.6393%, indicating that even after the breakthrough, short-term liquidity is still thin. The fully diluted valuation is US$362.96 million, with a total supply of 2.99 million GNO, and a circulating supply of 2.63 million $GNO. The number of holders is listed as 59,980, which is higher than the above-mentioned chain statistics because it summarizes holders on multiple networks.
What is the concentration of GNO holders?
Holder data shows that the token is highly concentrated: the top 100 addresses control 99.29% of the supply, while whales (defined as top holders) account for only 0.34% of the total holders, but hold 99.10% of the market value. 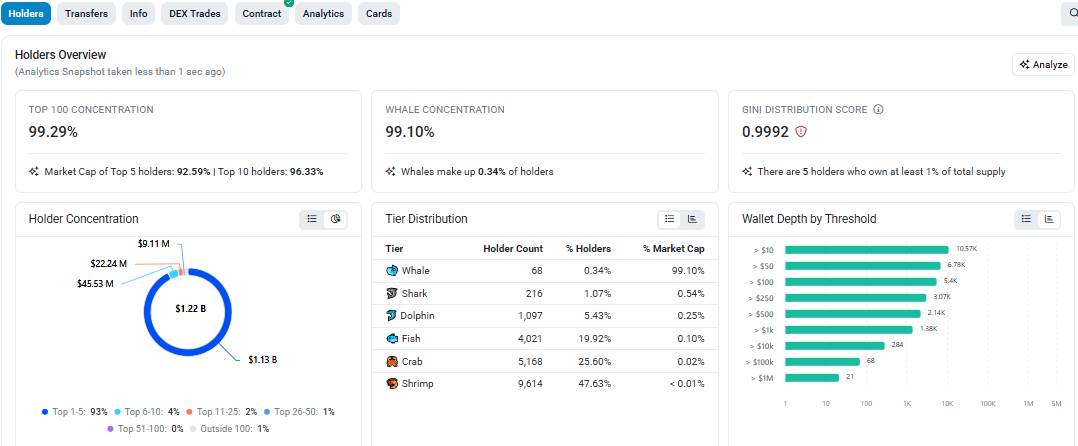 The Gini distribution coefficient is 0.9992, and the top five holders alone account for 92.59% of the market value. The largest address is labeled as Gnosis Vesting, holding 38.52%, followed by Gnosis Chain ETH-xDai Omni Bridge, holding 14.39%, both of which are protocol-related addresses rather than typical open market wallets-this is worth noting before drawing conclusions based solely on concentration.
Has GNO broken through its wedge shape on the daily chart?
Daily chart shows,GnosisAfter breaking through a wedge pattern that lasted for weeks with a strong positive line with high volume, prices have since been consolidating below resistance over the past two trading days rather than falling back. 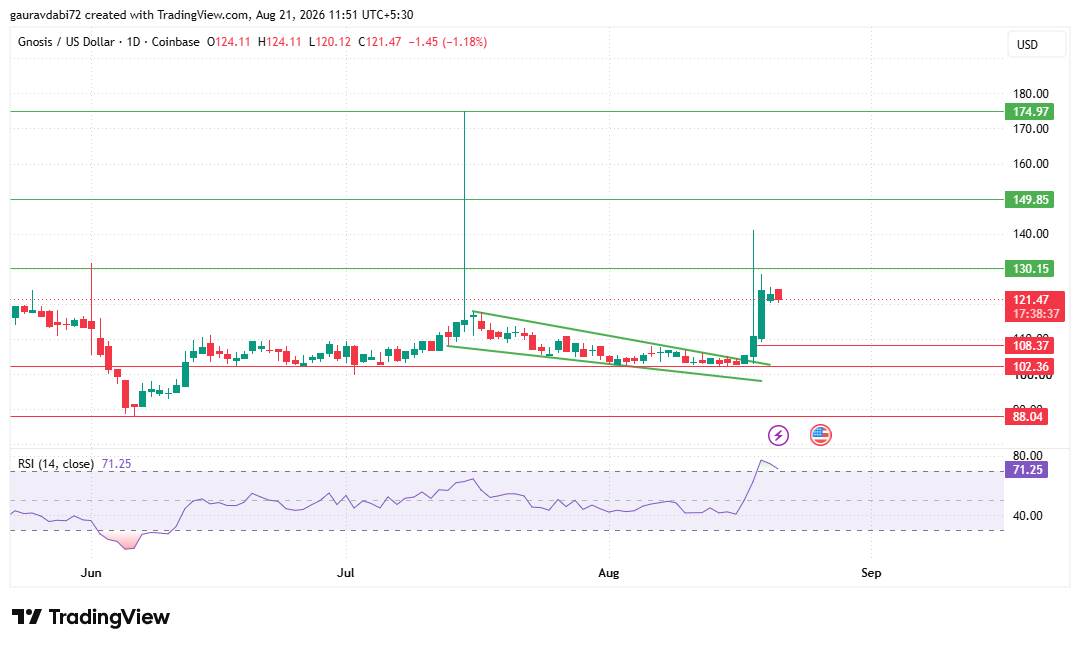 The RSI on the 14th was 71.25, placing $GNO in the overbought region, reflecting the speed of this round of gains. If buyers continue to actively defend current levels, the chart structure suggests that prices may break through resistance, while in a more neutral scenario,GNO could fluctuate between support and resistance for weeks.
What are the key resistance and support levels for GNO that need to be paid attention to?
On the upside side, the recent resistance of $GNO is US$130.15. If the breakthrough continues, the subsequent resistance will be US$149.85 and US$174.97. On the downside side, the first support level to pay attention to is US$108.37, and the deeper support is US$102.36 and US$88.04. In a neutral scenario,GNO is likely to trade between US$108 and US$130 in the coming weeks, and price performance around these levels will shape the next stage of this Gnosis price forecast .
Gnosis 2026 Price Forecast: What may happen next?
Taken together, the wedge breakthrough and the supply reduction proposal point in a similar direction: a token that is trying to break a long-term consolidation while its underlying token economy is tightening. Continuing to stand above $130.15 will open the path to $149.85 and ultimately $174.97. On the other hand, failure to break through resistance could keep $GNO between US$108.37 and US$130.15, and a deeper correction could test US$102.36 or US$88.04. For this $GNO price forecast , weak trading volume and high holder concentration mean that fluctuations can occur quickly, whether upward or downward.
How do analysts view this form of GNO?
Technical analysts pointed out that it is not common for confirmed wedge breakthroughs to be combined with ongoing supply reduction proposals to allow $GNO to gain both technical and fundamental triggers. At the same time, an RSI above 70 and an abnormally high whale concentration mean there is a real two-way risk to this pattern, and confirmation by breaking through resistance cleanly (rather than just breaking through the positive line) will enhance the reliability of the bullish argument.
Disclaimer : This article is for information purposes only and should not be regarded as financial or investment advice. The cryptocurrency market is highly volatile, and readers should conduct their own research before making any decisions.