Exchange Ranking
 Top Exchanges
 24h Volume Ranking
 Popularity Ranking
 Exchange BTC Balance
 Proof of Reserves
 Decentralized Exchanges
 Funding Rate
 Funding Heatmap
 Liquidation Data
 Max Pain
 Long/Short Ratio
 Whale L/S Ratio
 Binance/Okex/Huobi L/S
 Bitfinex Margin L/S
 ETF Tracker
 Solana ETF
 XRP ETF
 Hong Kong ETF
 Bitcoin Treasuries
 Crypto Reversal
 Ethereum Reserves
 HyperLiquid Wallet Analysis
 Hyperliquid Whale Watch
 Large Transactions
 On-chain Movement
 Bitcoin ROI
 Stablecoin Market Cap
 Options Analysis
 News
News Articles
 Economic Calendar
 Features
 Wallet
 Contract Calculator


 Security
 Collections
 Watchlist
 Following
 BTC
BTC  ETH
ETH  SOL
SOL At 17:08 UTC on August 27, Solana traded at US$109.41, the highest level for the year. During the same period, Bitcoin prices hovered around $80000. For the first time in months, the larger asset failed to dominate the market rhythm. This is no coincidence. Solana's first official on-chain governance vote ended at approximately 15:30 UTC on August 27, at the end of the 1023rd epoch. About two hours after the voting deadline, SOL broke through $109 and successfully overcame the resistance level of $102.70 that had blocked it the previous day (August 26). 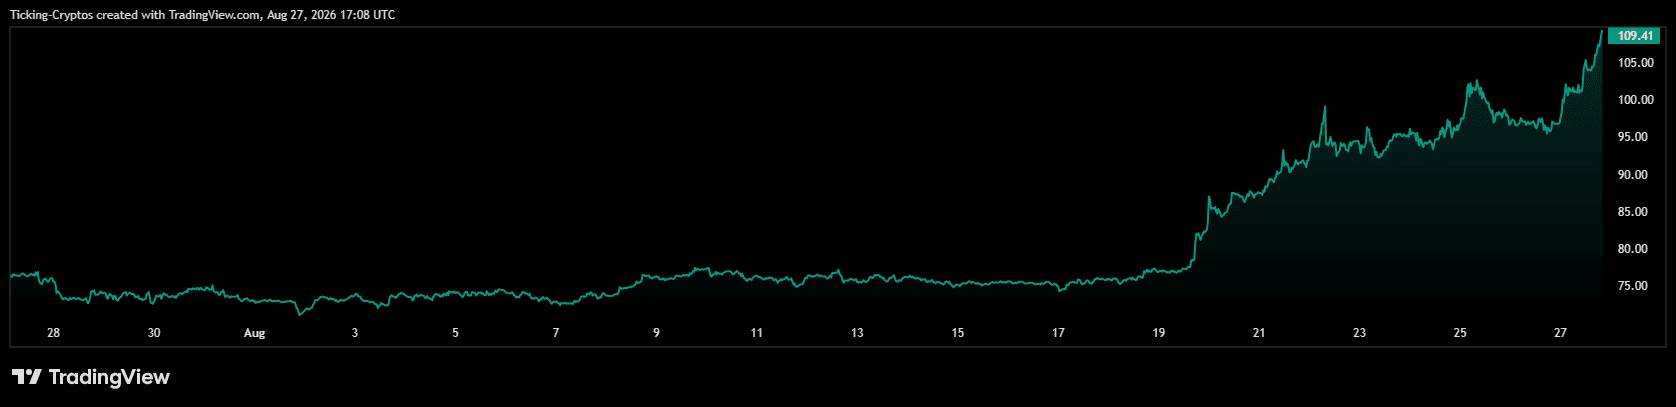
SOL/USD Chart
What is Solana's actual increase?
Since mid-August, SOL has risen about 46%, climbing from around $75 to above $109. Judging from the chart, this trend can be divided into three stages. From the end of July to the first half of August, SOL consolidated in a narrow range around US$75 and once reached a low on August 7. From August 9 to 18, SOL slowly rose to about US$78, but the momentum was still insufficient. Entering August 19, the nature of the trend completely changed: SOL quickly pulled up from the range of more than 70 US dollars to the range of more than 90 US dollars almost vertically. The third stage is the focus of most traders. As of August 25, SOL's 7th increase was 31.87%, and the 30th increase was close to 35.6%. After today's (August 27) rally, both indicators rose further. It is necessary to clarify the specific points that have been breached. SOL briefly touched US$102.88 on August 26, but was immediately suppressed and fell back to the middle of US$95. The leveraged long position encountered US$17.51 million liquidation that day. Resistance near $102.70 hit a 13-week high. Breaking through US$109 today (August 27) is the second time that this resistance level has been hit and it has successfully stabilized.
Does Solana really perform better than Bitcoin?
Indeed, Solana's performance is better from a weekly and monthly perspective, but the gap is not as wide as it feels. In the seven days ending August 25, Solana rose about 27%, while Bitcoin rose 23%. On August 26, SOL rose 1.5%, while Bitcoin fell 0.2%, falling back below $79000. Today's (August 27) market further widened this gap. It's worth noting that this is not a flow of funds from Bitcoin to Solana. On August 24, Bitcoin, Ethereum, Solana and Hyperliquid-related products listed in the United States attracted a total of approximately $192.6 million in funding needs. The Bitcoin ETF alone attracted $208.9 million that day, compared with about $1.6 billion the previous week. Both assets attract capital inflows at the same time. 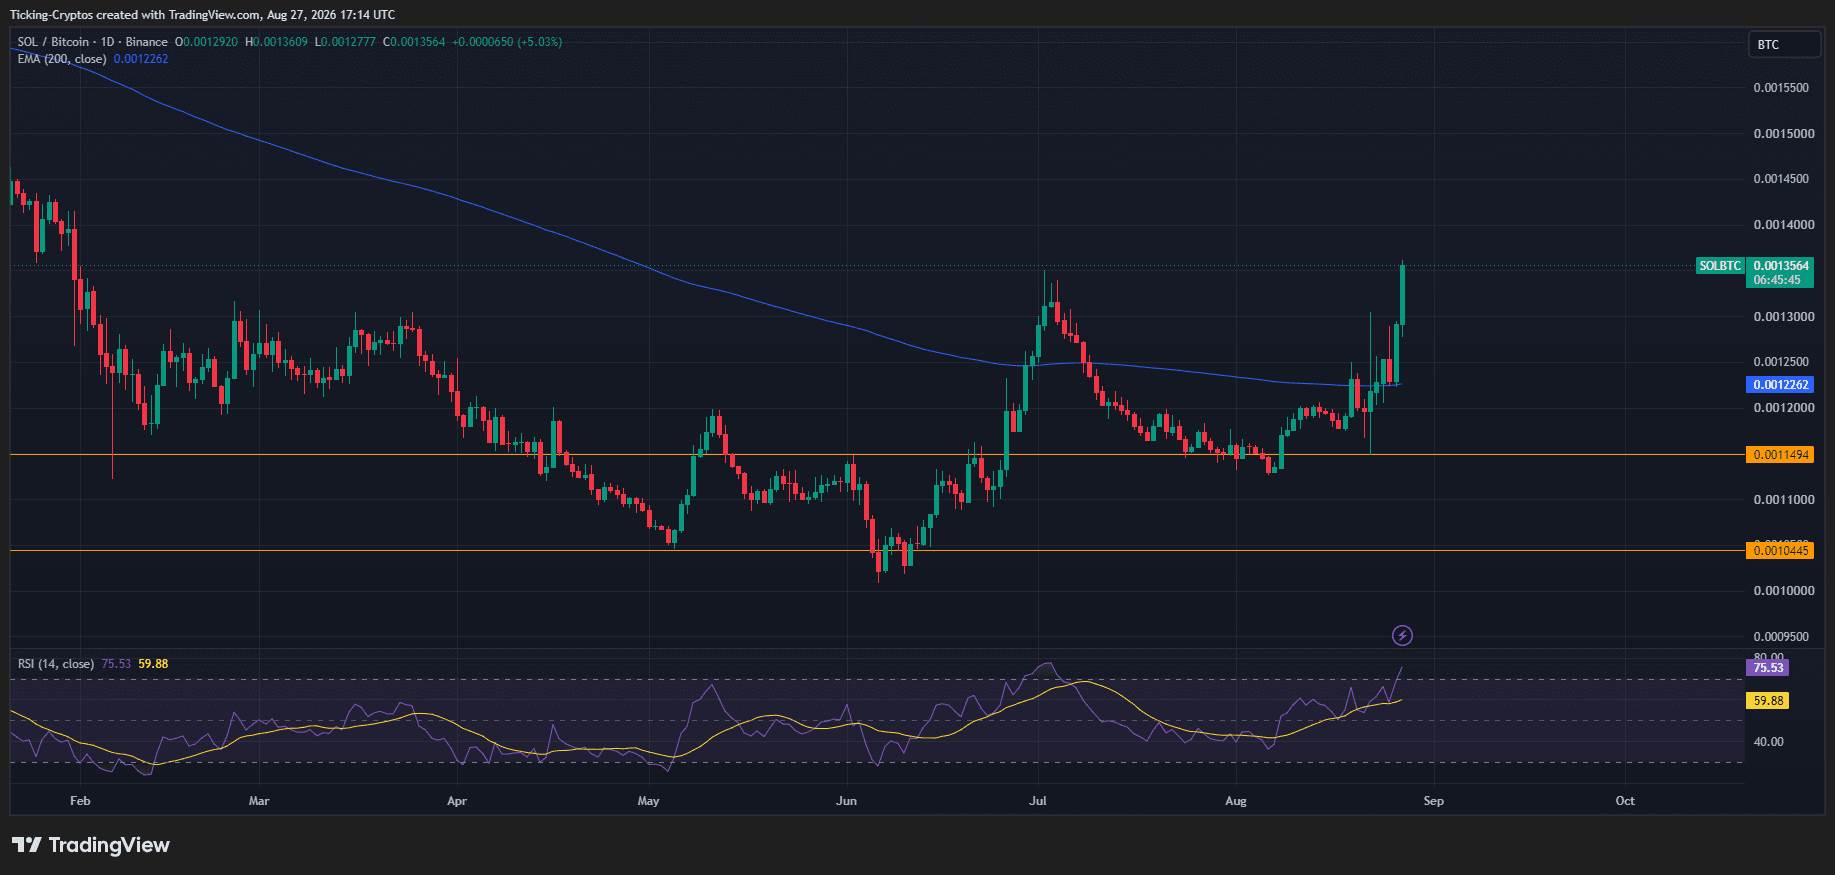 This difference is crucial to how to interpret the ratio of crypto-assets. Real rotation means that money flows out of one asset and flows into another. The current situation is more like an overall admission of new funds, with Solana gaining a disproportionate share due to its size advantage. It is a fact that its performance is excellent, but the saying of "rotating movement" is currently not true, at least not yet.
What exactly does the governance vote decide?
Between August 22 and 27, three proposals were voted on with pledge weights, two of which could significantly tighten the supply of SOL. This is the essence behind driving price changes, and it is also the part that most commentary articles ignore. SGP-0001 (Solana Charter) approved a standard governance framework and activated Solana's on-chain governance system, svmgov. SGP-0002 (Accelerating Deflation) doubled the annual deflation rate from 15% to 30%. According to SIMD-0550, the move would reduce future issuance of SOL by approximately 18.9 million over six years, worth approximately $1.7 billion at current prices. SIMD-0553 in SGP-0003 (Fee Restructuring) proposes a fixed inclusion fee of 2500 lamps per transaction, coupled with a dynamically adjusted resource fee portion that will be destroyed rather than paid for. This could increase the daily destruction volume from approximately 648 SOL to 9000 SOL, a nearly 14-fold increase. There are two important prerequisites that require more attention. First of all, a vote only means approval of development. Technology implementation, testing, and on-chain activation will be carried out separately through the SIMD process, so there will be no change in the supply of SOL at the end of the vote. Second, Nasdaq-listed Solana Company (code HSDT) supported the charter but voted against accelerating deflation and fee reform. When major stakeholders are so divided in votes, the narrative of supply shocks is not as consistent as price movements imply.
Are the three technical arguments valid?
Partially true, but one of them has two sides. There are three arguments currently circulating in the market: the SOL/BTC exchange rate hit a seven-month high; the RSI (Relative Strength Index) broke through a five-year downward trend; and SOL rebounded from key support levels formed since 2021. These three arguments all stem from chart interpretation rather than reporting data, and should therefore be regarded as analyst views rather than given facts. Observations on the SOL/BTC exchange rate are consistent with the direction of price data. When SOL is $109.41 and Bitcoin is close to $79000, the exchange rate is around 0.00138. The last time SOL exceeded $100 was in February 2026. Whether this constitutes a clear seven-month high depends on how you measure the price of Bitcoin, and we have not independently verified the specific reading. The support argument is based on a trend line drawn starting in 2021. SOL/BTC has been in a large-level downward trend since mid-2021, so it will be important if it rebounds from this long-standing support level and eventually stabilizes. However, this cannot be confirmed from the reported data, and the trend line spanning five years is extremely sensitive to mapping positioning. The RSI argument needs to be treated with caution because it points in both directions at the same time. Breaking through the long-term RSI downtrend is a momentum signal. But the same indicator recently read 84.31 on the 14-day time frame and hit around 79 when it encountered resistance on August 26. Both readings are in deeply overbought areas. Anyone who cites the RSI as strong evidence should also view it as evidence that the market may be failing, because it is the same indicator value.
Is ETF demand real?
This is the most solid part of the argument because it is based on reported data rather than inferences. The U.S. spot Solana ETF attracted US$33.5 million on August 24, the largest one-day net inflow since December 2025 and the highest level so far this year. This extended the number of consecutive net inflows to five days, and the cumulative total net inflows reached a record of US$1.22 billion. On-chain data also provides support. Solana processed 4.2 billion transactions in July. The size of stablecoins on the Internet is approximately US$15.94 billion, the weekly DEX (Decentralized Exchange) transaction volume is close to US$19.74 billion, and the size of tokenized assets is close to US$4 billion. Galaxy Digital launched a SOL-backed lending service on August 26, allowing holders to borrow without selling pledged SOL, adding a channel for holding rather than rolling out. Corporate treasury needs also exist. Forward Industries holds more than 6.9 million SOLs and operates its own verification node.
What factors may break the current situation?
Technical readings of overbought, the time lag between voting and actual execution, and the trend of Bitcoin itself. The most direct risk comes from the position structure. After a 46% gain, the RSI is above 80, which is usually a classic condition for a sharp correction. When the breakthrough failed yesterday (August 26), the liquidation scale of long positions of US$17.51 million demonstrated the speed at which this situation occurred. The first hit of $102.88 was suppressed within hours. The second risk is the time lag between the vote being passed and the actual supply changes. If traders buy based on expectations of a "supply shock" that will not affect SOL in circulation for several months, the catalyst has been exhausted and the fundamentals have not changed. Votes that only approve development are the ones most likely to be over-priced. On the downside, the key level to watch is $94.42 (23.6% Fibonacci retracement), then $88.18, and the 200-day moving average below it (approximately $81.15). The third risk is a factor that no one can control: Bitcoin needs to hold on to the $75000 to $76000 range. High-beta assets, which have risen by 46%, will not fall proportionately when the market turns, but will fall even harder. Currently, SOL's funding rate is at a high level. Federal Reserve Chairman Kevin Walsh will deliver his first keynote speech at the annual meeting of global central banks in Jackson Hole on August 28, which means that a macro event will be placed directly in front of a market with a high concentration of positions.
Conclusion
Unlike most such assertions this month, Solana outperformed Bitcoin for recognizable reasons: record ETF demand, real network usage, and credible supply-side arguments. Whether this excellent performance can be sustained in the face of overbought technical charts and fledgling governance processes is an independent question.