Exchange Ranking
 Top Exchanges
 24h Volume Ranking
 Popularity Ranking
 Exchange BTC Balance
 Proof of Reserves
 Decentralized Exchanges
 Funding Rate
 Funding Heatmap
 Liquidation Data
 Max Pain
 Long/Short Ratio
 Whale L/S Ratio
 Binance/Okex/Huobi L/S
 Bitfinex Margin L/S
 ETF Tracker
 Solana ETF
 XRP ETF
 Hong Kong ETF
 Bitcoin Treasuries
 Crypto Reversal
 Ethereum Reserves
 HyperLiquid Wallet Analysis
 Hyperliquid Whale Watch
 Large Transactions
 On-chain Movement
 Bitcoin ROI
 Stablecoin Market Cap
 Options Analysis
 News
News Articles
 Economic Calendar
 Features
 Wallet
 Contract Calculator


 Security
 Collections
 Watchlist
 Following
 HBAR
HBAR HBAR experienced a 16% correction after completing its four upward targets and gained support in key sniper target areas.
The current pending order buy signal was issued and the price structure is converging, putting HBAR in a position of solid support. A critical position between downtrend line resistance. Market cap and capital flow data show signs of stabilization, but strong demand still needs to be maintained if the bullish trend continues.
HBAR's market recovery is entering a crucial technical stage. Bulls are defending support, challenging downtrend line resistance and waiting for confirmation of emerging buy signals.
HBAR finds key support after completing its target
Jesse Olson reported that HBAR has hit all four previously set upward targets. Subsequently, the asset fell about 16% from its recent highs. However, when prices hit the much-watched sniper target area, buying immediately emerged. <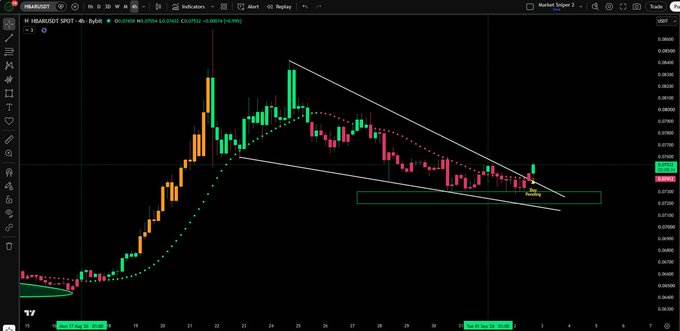 >
>
Source: X Platform
The four-hour chart shows that there was a strong rebound before the current correction. During that rally, multiple positive lines pushed HBAR to break through the successive resistance level. As prices reached their early upside targets, momentum then weakened.
This correction created a different short-term market structure for traders. Prices began to record lower highs below a clear downtrend line resistance. Several attempts at recovery stalled before effectively breaking through the barrier.
Still, the adjustment did not turn into continued structural damage. Buyers have repeatedly defended the green-marked support area below recent transactions. This response has kept broader attempts at recovery technically active for now.
Downtrend line constitutes a clear technical decision area
HBAR's market recovery now depends largely on the interaction of support and resistance. Since the correction, prices have gradually compressed into a narrowed range. This pattern reflects the increasing pressure as market boundaries move closer to each other.
The latest trading activity shows buyers repeatedly challenging the downtrend line. Once the resistance level is confirmed to be breached, the sequence of lower highs will be interrupted. Subsequent continued trading will provide stronger confirmation of the buy signal for pending orders.
As of writing, HBAR was trading at US$0.077 after a intraday rebound. This increase was achieved through multiple consecutive increases, rather than a single vertical K-line pull-up. During the climb, early pullbacks were absorbed at lower intraday levels. Image link
The US$0.075 to 0.076 region has become increasingly important after recent transactions. Maintaining these levels of recovery protects the emerging sequence of high and low points. On the contrary, if prices weaken again, prices may return to the established support area.
Capital flow and market value show signs of stabilization
The broader chart shows a long-term contraction in prices and market capitalizations. HBAR fell from approximately US$0.15 to US$0.16 to the current US$0.07 region. During that decline, temporary recovery repeatedly failed to establish lasting higher highs. <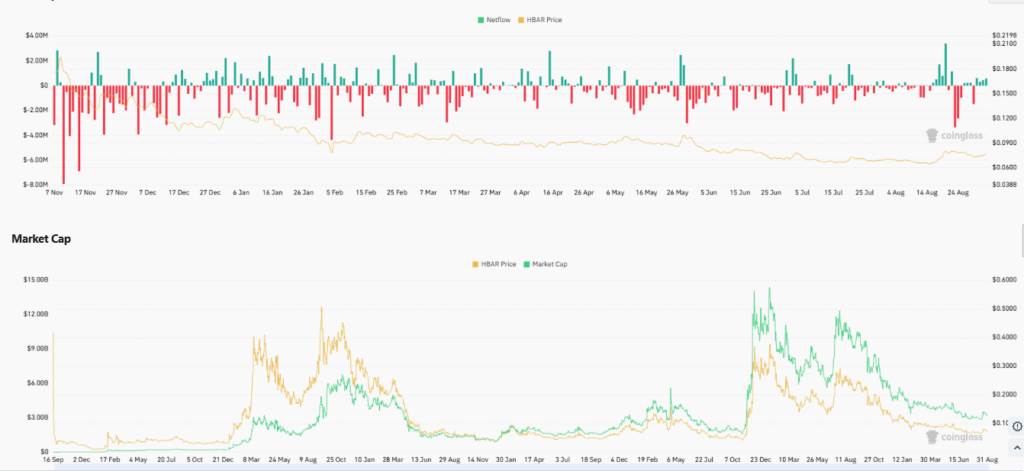 >
>
Source: Coinglass
Money flow data also reflects persistent pressures throughout the larger decline. The red bar chart dominates the chart, showing recurring net outflows of capital. However, intermittent green peaks occurred during April, May and August.
These periods of positive flow have not produced sustained reversals. Still, recent price behavior suggests that selling pressures may be losing momentum. Lower levels of sideways trading replaced the early pace of decline.
Market capitalization follows a similar historical pattern in visible charts. Early expansion had pushed valuations beyond $12 billion and moved towards $15 billion. The recent contraction has brought market values back into the $3 billion to $4 billion range.
Currently, HBAR's market recovery relies on confirmations rather than expectations. Continued breakthroughs can verify pending order signals and restore upward momentum. If you fail at resistance, the consolidation pattern will remain intact and put pressure on support.