Exchange Ranking
 Top Exchanges
 24h Volume Ranking
 Popularity Ranking
 Exchange BTC Balance
 Proof of Reserves
 Decentralized Exchanges
 Funding Rate
 Funding Heatmap
 Liquidation Data
 Max Pain
 Long/Short Ratio
 Whale L/S Ratio
 Binance/Okex/Huobi L/S
 Bitfinex Margin L/S
 ETF Tracker
 Solana ETF
 XRP ETF
 Hong Kong ETF
 Bitcoin Treasuries
 Crypto Reversal
 Ethereum Reserves
 HyperLiquid Wallet Analysis
 Hyperliquid Whale Watch
 Large Transactions
 On-chain Movement
 Bitcoin ROI
 Stablecoin Market Cap
 Options Analysis
 News
 Articles
 Economic Calendar
 Features
 Wallet
 Contract Calculator


 Security
 Collections
 Watchlist
 Following
 LINK
Summary: Contents
LINK broke through the seven-month consolidation range, and exchange supply remained at multi-year lows.
LINK broke out of the seven-month consolidation range between US$7 and US$10 in September, and prices rebounded from US$9 to above US$15.50. Throughout the September-October rally, the exchange's reserves remained basically flat at between 124 million and 130 million LINK. The current reserve level is approximately 124.3 million LINK, which is at a low level in many years and far below the peak of 190 million in early 2024. Historical surge in reserves has tended to occur near local highs, and analyst R3N is closely watching whether this will occur if LINK approaches its highs.
LINK breaks through seven-month consolidation range
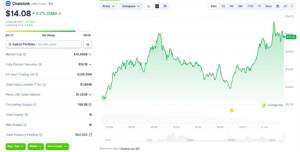
This market ends months of sideways trading in the token. LINK's price climbed from nearly $9 to a peak of more than $15.50. As of writing, it was trading at $14.08, below its previous high. At the same time, the performance of exchange reserve data is different from previous upstarts.
Source: Coingecko
Analyst R3N points to the Chainlink exchange reserve chart since the end of 2023. The chart shows a recurring jagged pattern: reserves gradually accumulate and then rise sharply in a single operation. According to analysts, this cycle has occurred many times.
This pattern appears at least six to seven times. Examples include early 2024, mid-2024, late 2024, early 2025, mid-2026. Several of these surges occurred near local price highs, while others occurred before periods of weak prices.
Such surges are usually associated with the transfer of tokens to exchanges before potential sell-offs. However, the recent rally did not follow that script. In the September-October market, reserves remained basically between 124 million and 130 million LINK, without any sharp surge that accompanied the breakthrough.
Exchange supply remains at multi-year lows
Chainlink's exchange reserves currently stand at 124.3 million LINK. This level is close to the lowest point within the multi-year window shown and well below the peak of 190 million recorded in early 2024. This marks a drop of approximately 66 million LINK from its peak.
This decline is a mixture of gradual reductions and cyclical surges. Even with these surges, the overall trend remains downward. This multi-year downward trend in the supply of tradeable exchanges has persisted over multiple price cycles and therefore reflects a long-term structural decline rather than recent volatility.
R3N describes the current situation as different from comparable markets in the past. The absence of a typical surge in reserves suggests that less new supply is entering the exchanges. This surge has marked several previous highs on the same chart. Analysts added that this does not prove that the rally will continue.
Looking ahead, analysts are watching whether Chainlink exchange reserves will eventually surge as the rally continues. Another trigger point is LINK's return to recent highs. Historically, this area has often been the place where this pattern emerged. Reserve levels will remain at multi-year lows until a surge occurs.