Exchange Ranking
 Top Exchanges
 24h Volume Ranking
 Popularity Ranking
 Exchange BTC Balance
 Proof of Reserves
 Decentralized Exchanges
 Funding Rate
 Funding Heatmap
 Liquidation Data
 Max Pain
 Long/Short Ratio
 Whale L/S Ratio
 Binance/Okex/Huobi L/S
 Bitfinex Margin L/S
 ETF Tracker
 Solana ETF
 XRP ETF
 Hong Kong ETF
 Bitcoin Treasuries
 Crypto Reversal
 Ethereum Reserves
 HyperLiquid Wallet Analysis
 Hyperliquid Whale Watch
 Large Transactions
 On-chain Movement
 Bitcoin ROI
 Stablecoin Market Cap
 Options Analysis
 News
 Articles
 Economic Calendar
 Features
 Wallet
 Contract Calculator


 Security
 Collections
 Watchlist
 Following
 BTC
TLDR: Directory switch
Bitcoin price is limited below $87,000
Institutional capital inflows and employment data shape market sentiment
On October 3, Bitcoin fell 1.6% after failing to hold on to gains near $87,220, and the trading price hovered around $84,668. Analyst Crypto with Haris pointed out that resistance is between $86,000 and $87,000, and if it breaks below this range, prices could fall back to $62,000.
BlackRock's IBIT purchases reached US$195.6 million in a single day, while Fidelity ETF customers added US$29.28 million in investments. At the same time, non-farm payrolls increased by only 29,000 in September, well below the expected 90,000, and the unemployment rate climbed to 4.2%.
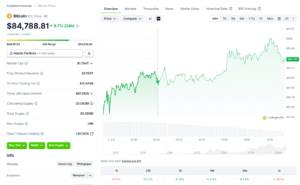
On October 3, the price of Bitcoin hovered around US$84,788, down 1.6% from the previous increase that failed to hold around US$87,220. According to chart data, the lowest for the day hit US$83,888.
Traders pay close attention to the main trend line support level, and if this level is breached, US$83,000 will become the next key level. Shorts are expected to decline further, while bulls point to stable institutional buying. At the same time, rising liquidation volumes and sideways shocks continue to dominate the market trend. Asset prices remain trapped in a narrow range of $83,000 to $87,000.
Bitcoin price is limited below US$87,000
Bitcoin's price volatility has remained within a narrow range of $83,000 to $87,000. The buyer had pushed the assets higher to $87,220, but the rebound later subsided. Sellers re-entered and the price slipped to an intraday low of $83,888, just above the $83,000 level. As a result, markets became volatile.
Analysts Crypto with Haris hold a bearish view. He pointed to stubborn resistance between $86,000 and $87,000. Rejections from the region could cause BTC to fall to US$62,000. This target price is approximately $22,700 lower than the current Bitcoin price.
I told you not to believe these false $BTC pull-ups. 86K-87K is a very strong resistance level, and BTC has failed to break through it many times. This doesn't look like a real bull market. If it were a real bull market, BTC would not stagnate between 83K and 87K for nearly three weeks. In a strong bull market, small...(original truncated)
At the same time, the chart shows a major trend line serving as support. If that line is broken,$83,000 will become the next critical level. As a result, traders are watching this trend line closely. As a result, markets remain divided on the next step.
Liquidation volumes are also rising during periods of sideways volatility. Despite this, the bulls have not given up their bullish view. This view is based on stable institutional buying. Overall, Bitcoin remains in a wait-and-see mode between key support and resistance levels.
Institutional capital inflows and employment data shape market sentiment
The flow of institutional funds remains the focus of attention for bulls. BlackRock's IBIT purchases reached $195.6 million in a single day. In addition, Fidelity ETF customers contributed $29.28 million. These purchases have injected momentum into hopes of breaking through the gains. The inflow occurred against the backdrop of rising sideways trading and clearing volumes.
Macro data also shaped Bitcoin's volatility this week. U.S. inflation, growth and labor data have reshaped expectations for Fed policy.
At the beginning of the week, BTC fell to about US$82,600, and then rebounded quickly. U.S. PCE inflation data was lower than expected, while JOLTS data showed weakening labor demand. The September jobs report, which triggered the biggest reaction, followed PCE and JOLTS readings released earlier this week.
Non-agricultural employment increased by only 29,000, far below the consensus forecast of 90,000. Unemployment rose to 4.2%, and wage growth slowed, easing pressure on the Fed to raise interest rates again. After the report was released, BTC soared to approximately $87,100. But the rebound quickly subsided and the price returned to $84,500. Reducing interest rate hikes alone may not be enough to maintain the rally.
Treasury yields, US dollar, oil prices and inflation risks remain key factors. These factors continue to affect Bitcoin prices. The next step may follow a chain: inflation, the Federal Reserve, Treasury yields, the US dollar and Bitcoin.