Exchange Ranking
 Top Exchanges
 24h Volume Ranking
 Popularity Ranking
 Exchange BTC Balance
 Proof of Reserves
 Decentralized Exchanges
 Funding Rate
 Funding Heatmap
 Liquidation Data
 Max Pain
 Long/Short Ratio
 Whale L/S Ratio
 Binance/Okex/Huobi L/S
 Bitfinex Margin L/S
 ETF Tracker
 Solana ETF
 XRP ETF
 Hong Kong ETF
 Bitcoin Treasuries
 Crypto Reversal
 Ethereum Reserves
 HyperLiquid Wallet Analysis
 Hyperliquid Whale Watch
 Large Transactions
 On-chain Movement
 Bitcoin ROI
 Stablecoin Market Cap
 Options Analysis
 News
News Articles
 Economic Calendar
 Features
 Wallet
 Contract Calculator


 Security
 Collections
 Watchlist
 Following
 EIGEN
EIGEN This EigenLayer price forecast (September 2026) focuses on a pattern that has been quietly tightening for months. EIGEN has been consolidating within the shrinking triangle, and the price performance when it was put on the track last test was completely different from before. Prices did not rise and fall back as usual, nor did they hit a new low, but stabilized at their current position. This subtle but critical change has caused traders to pay close attention to this pattern. The following is a complete analysis.
EIGEN Price Today: Real-time data and 24-hour changes
On the weekly chart, EIGEN is currently trading at approximately US$0.2038. The opening price for the week was around US$0.2304, hitting a high of US$0.2327, falling to a low of US$0.1944, and finally closing at US$0.2038, a decline of 11.51% this week. Broader market data showed EigenLayer's price was approximately US$0.2047, a drop of nearly 1.25%. Futures trading volume was US$35.19 million, spot trading volume was US$4.91 million, and open interest was approximately US$30.85 million. Based on a circulating supply of 1.77 billion EIGEN (currently not listed a fixed maximum supply), the market value is approximately US$285.07 million.
EIGEN holder concentration data
Holder concentration data shows that the market is still highly concentrated in the largest wallet addresses. 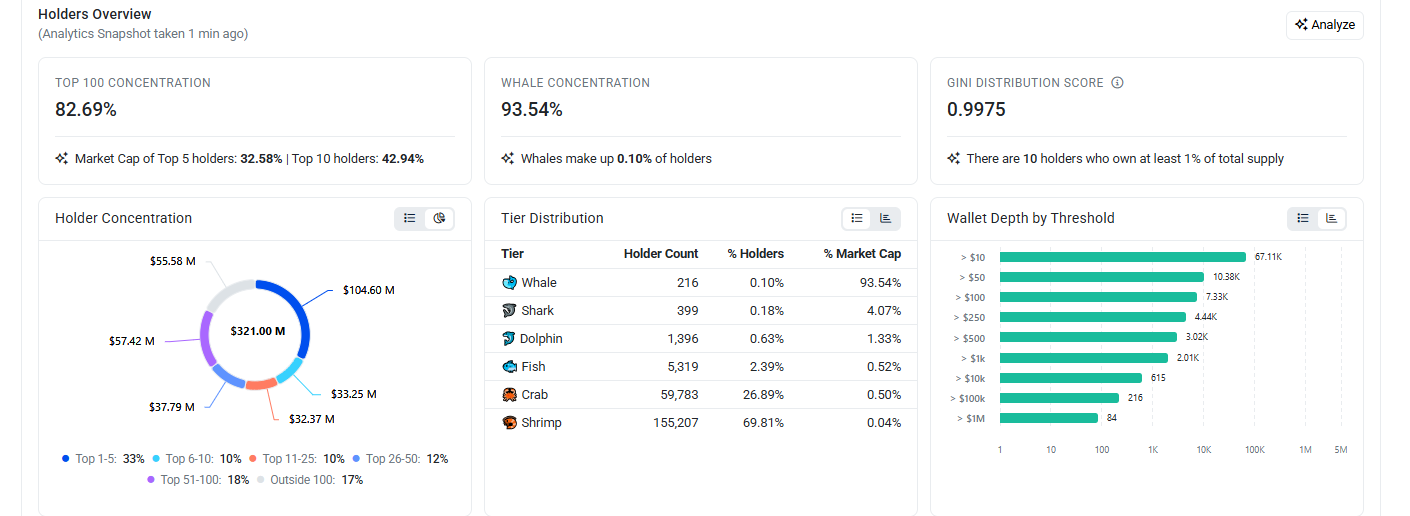 The top 100 holders control 82.69% of the tracked supply, valued at approximately $321 million. Among them, the top 5 holders accounted for 32.58% of the market value, and the top 10 holders reached 42.94%. Giant whale wallets only account for 0.10% of all holders, but control 93.54% of the tracking value. The Gini distribution coefficient is 0.9975, which reflects the high concentration of ownership. Currently, only 10 holders each have at least 1% of the total supply.
 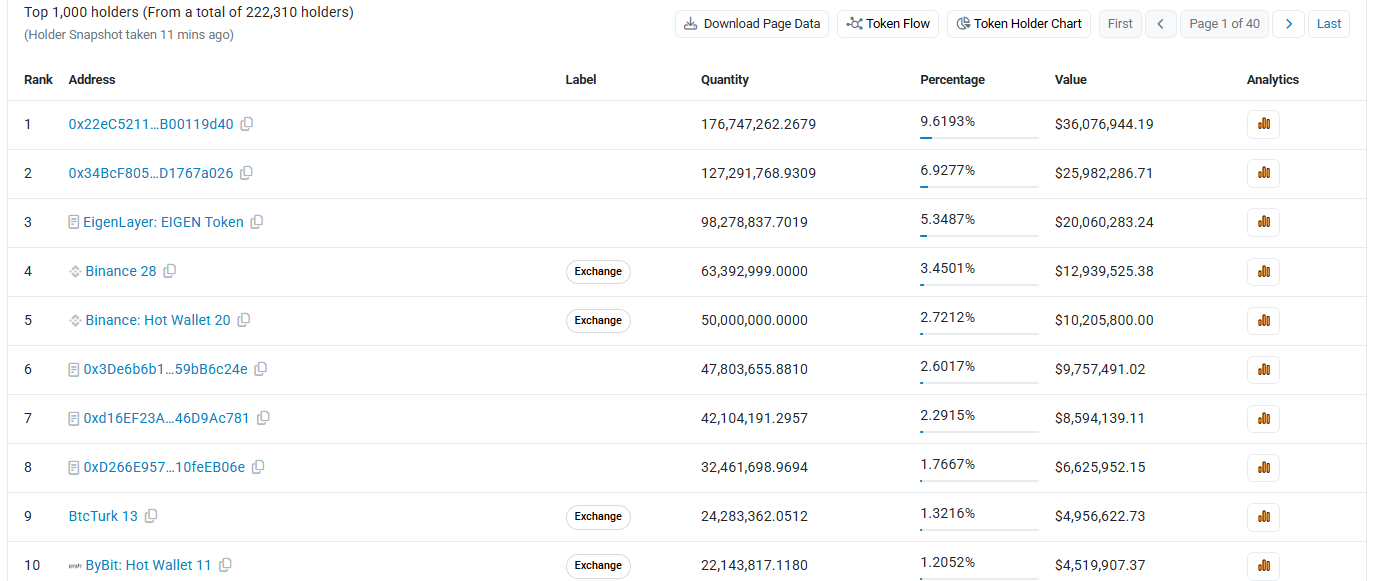 Looking specifically at the top addresses, the largest wallet holds 9.62% of the supply, the second largest unmarked wallet holds 6.93%, and the EigenLayer token contract itself holds 5%. Exchange-marked wallets also stand out at the bottom of the rankings, including Binance addresses (holding 6.17% in total), and BTCTurk and ByBit hot wallets (holding just over 1% each). This mixture of large unmarked wallets, token contracts, and multiple exchange custody addresses suggests that concentration of EIGEN tokens is driven by a combination of liquidity held by early holders and exchanges, rather than a single project vault. This is an important difference when interpreting concentration data for EIGEN tokens.
Quick view
Current market price: US$0.2038
Weekly bullish trigger: Weekly closing price above US$0.3156, confirmed a symmetrical triangle breakthrough, target US$0.6603, then US$1.0000.
Weekly bearish failure: If the weekly closing price is below US$0.1472, the bullish structure will fail.
Data as of August 27, 2026, IST.
Short-term risk warning: These key levels are based on weekly charts and depend on confirmed weekly closing prices rather than intraday shadows. If leveraged positions are established near these areas, you will face liquidation risks if prices fluctuate significantly before key levels are confirmed.
EigenLayer September 2026 technical forecast
For the past few months, EIGEN has been compressing within the symmetric triangle. The pattern consists of a downward upper trend line connecting a series of lower highs and an upward lower trend line consisting of a series of higher lows. 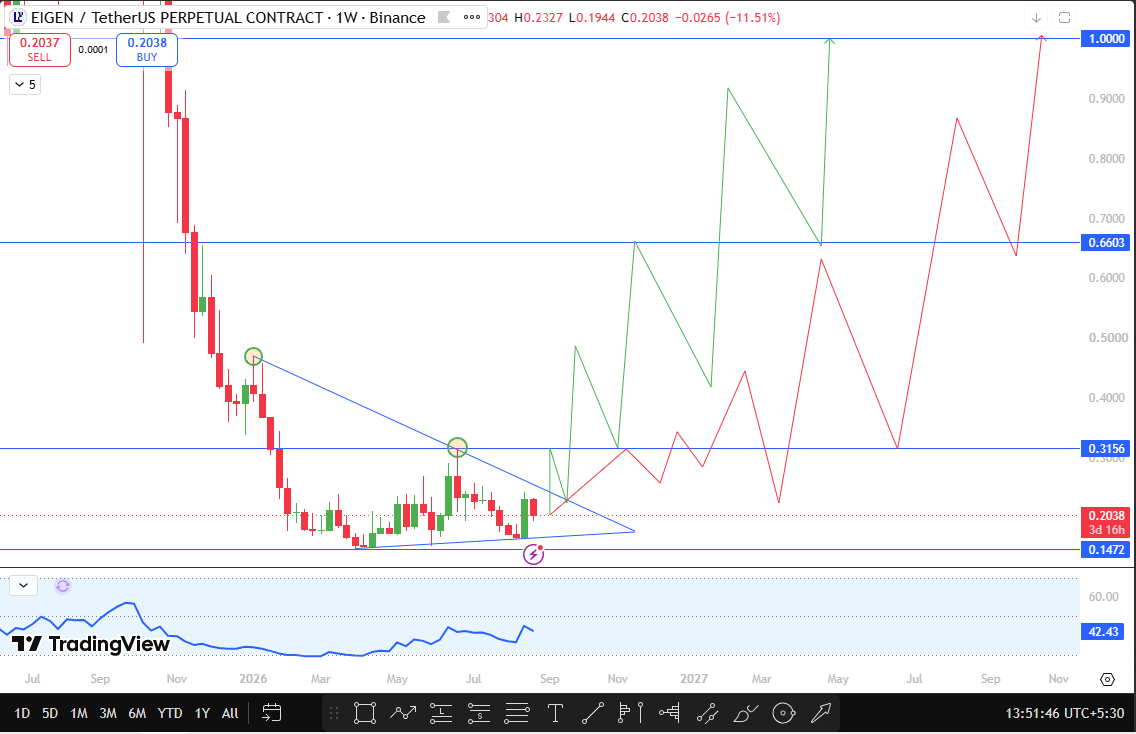 This pattern continues to narrow, and prices are now close to the peak where the two trend lines meet, which is usually the key point when the triangle is about to choose the direction of breakthrough.
During the most recent test of the upper trend line, it was worth noting that prices did not hit new lows in subsequent pullbacks, which was completely different from previous tests of the pattern. This behavior of holding on to the structure rather than setting a new low often indicates that sellers 'beliefs are weakening even before a breakthrough occurs. This is one of the early signs that bullish momentum may be brewing at the bottom.
If EIGEN's weekly close above $0.3156, a symmetrical triangle breakthrough will be confirmed, marking a turn in bullish price behavior. Based on this, this September 2026 EigenLayer technical analysis regards US$0.6603 as the next resistance level, which was a high point in the previous decline. Breaking through that level would open up space for the psychological barrier of $1.0000. If the breakthrough continues, this integer mark will become an important milestone in this September 2026 EIGEN price forecast.
On the downside, this bullish structure will remain valid as long as EIGEN remains above US$0.1472. A weekly close below that level would completely negate the bullish structure, indicating that the triangle has broken downward and the broader downtrend has regained control of the market. Like the top target, this support comes directly from a previous low on the chart, rather than a randomly set number.
EIGEN Key Support and Resistance Levels
Levels: Support
Price: 0.1472 USD
Current price change: -27.77%
Notes: Previous low; Weekly closing prices below this level will negate the bullish structure
Level: Resistance
Price: US$0.3156
Current price change: +54.86%
Notes: Triangle upper trend line and recent lower highs; weekly closing prices above this level confirm a breakthrough
Level: Resistance
Price: US$0.6603
Current price change: +223.99%
Remarks: Previous high, first main target after breakthrough
Level: Resistance
Price: US$1.0000
Current price change: +390.68%
Remarks: Main psychological resistance and upside target
EigenLayer price forecast: Bullish, Benchmark and Bear Scenarios
Benchmark Scenarios: EIGEN will continue to consolidate near the apex of the triangle for most of September, and will neither confirm a weekly close above $0.3156 nor fall below $0.1472.
Bullish scenario: A weekly close above US$0.3156 is triggered, confirming a symmetrical triangle breakthrough, first opening up the path to US$0.6603 and eventually pointing to the psychological target of US$1.0000. This September 2026 EIGEN breakthrough forecast is based on the failure of a recent trend-line test to hit a new low, which is a subtle but meaningful shift in price behavior compared to earlier pattern tests.
Bear scenario: Requires a weekly close below $0.1472, which means that the triangle has broken downward, returning to the focus of testing lower lows, and suggests that the broader downtrend that has shaped the chart's shape since the launch of the token is still under control.
On-chain and fundamental drivers
EigenLayer's role as a re-pledge agreement connects the long-term value of EIGEN to the activity of the proactive verification service ecosystem, giving the token practical use related to cybersecurity needs rather than pure speculation. The holder data here is also worth considering. Given that whale wallets control more than 93% of the tracking value and the Gini coefficient is close to 1, EIGEN's price behavior may be excessively influenced by the decisions of a relatively small number of large holders, including exchange-managed wallets among the top ten addresses. This concentration profile means that regardless of overall market conditions, the re-holdings or sell-offs of any of these large wallets could significantly affect this September 2026 EigenLayer price outlook.
September 2026 Catalyst
EIGEN The most direct catalyst is whether the market can convert the current pattern into a weekly closing price confirmed above US$0.3156 in the next few weeks. In addition to the chart itself, the activity of unmarked large wallets and exchange-marked wallets identified in holder data, the broader sentiment in the re-pledge and liquidity pledge sectors, and the overall crypto market liquidity conditions may all have a significant impact on this 2026 September EIGEN price target.
EigenLayer Outlook Risks
The main risk to this bullish view lies in the triangular choice of a downward breakthrough, which makes a decisive breakthrough in any direction more likely under the increasingly tightening structure. A weekly close below $0.1472 would confirm this scenario. Broader risks include: movements in the wallets of large holders shown in concentration data, slowing activity in the re-pledge sector, and fluctuations in the overall crypto market. Any of these factors may override EIGEN's own chart structure, no matter where its technical position lies.
How to buy and store EigenLayer
EIGEN can be purchased through the spot or futures markets of major exchanges. Based on current exchange positions, platforms such as Binance, ByBit and BtcTurk provide active EIGEN trading pairs. For long-term holdings, transferring EIGEN to unmanaged wallets remains standard safe practice, while active traders may prefer to keep small amounts of money on exchanges to trade around these key technology levels.
Glossary
Symmetric triangle: A chart form consisting of a downward trend line and an upward trend line, converging towards the apex, usually triggering breakthroughs.
Trend line breakthrough: The price closing price exceeds the trend line that previously suppressed prices.
Weekly closing price: The final trading price at the completion of the weekly candle chart, used to confirm whether a breakthrough or break is true.
Re-pledge: A mechanism that allows pledged assets to provide security for other agreements outside the underlying network, extending their economic security.
Support level: The price area in which buying has historically intervened.
Resistance level: The price area where selling has historically suppressed price gains.
Failure level: The price point at which the forecast scenario is considered untenable.
Disclaimer
This document is for information purposes only and does not constitute financial advice. The cryptocurrency market is highly volatile, and all price levels discussed are based on technical chart analysis and are not guarantees of future performance. Readers should study for themselves before making any investment decisions.