Exchange Ranking
 Top Exchanges
 24h Volume Ranking
 Popularity Ranking
 Exchange BTC Balance
 Proof of Reserves
 Decentralized Exchanges
 Funding Rate
 Funding Heatmap
 Liquidation Data
 Max Pain
 Long/Short Ratio
 Whale L/S Ratio
 Binance/Okex/Huobi L/S
 Bitfinex Margin L/S
 ETF Tracker
 Solana ETF
 XRP ETF
 Hong Kong ETF
 Bitcoin Treasuries
 Crypto Reversal
 Ethereum Reserves
 HyperLiquid Wallet Analysis
 Hyperliquid Whale Watch
 Large Transactions
 On-chain Movement
 Bitcoin ROI
 Stablecoin Market Cap
 Options Analysis
 News
News Articles
 Economic Calendar
 Features
 Wallet
 Contract Calculator


 Security
 Collections
 Watchlist
 Following
 DOGE
DOGE DOGE held on to reclaimed support, and rising volume made the $0.095 resistance and the $0.10 target clearly visible
Daily-level momentum remained constructive as DOGE trading prices stabilized above its nine-day indexed moving average (DEMA). The Relative Strength Index (RSI) is close to 63.51 and trend line support remains solid. With the recovery of DOGE, trading activity surged, making $0.095 and $0.10 key levels, while $0.083 constitutes a broader base support area.
Dogecoin prices test key resistance levels after experiencing a strong rebound, while stronger trading activity and improved market momentum put $0.10 in focus.
DOGE regains key support
Alex Marzell tweeted that DOGE regained the $0.088 level after holding on to basic support of $0.083. His chart shows six four-hour K-lines stabilizing near the support level below. A subsequent wave of four-hour gains pushed DOGE from approximately $0.0876 to around $0.0952.
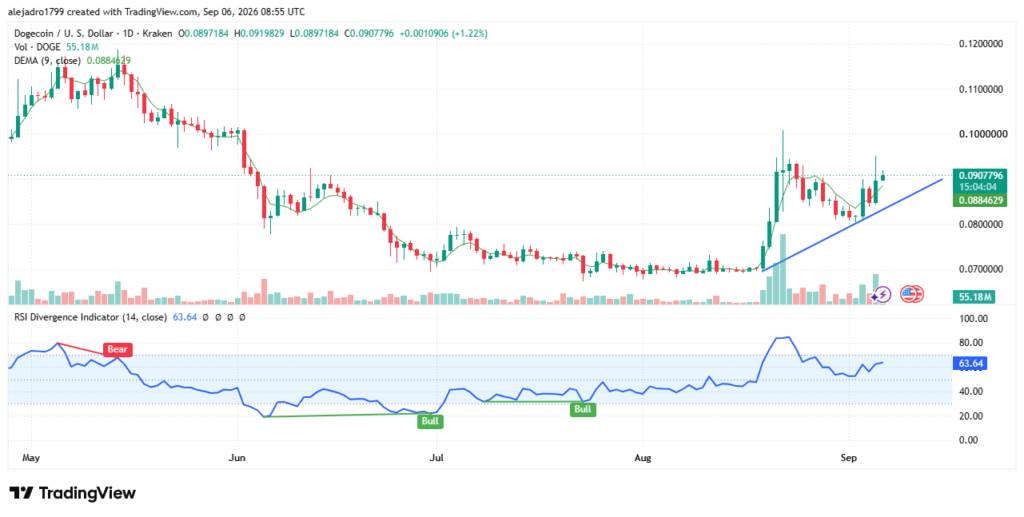
The daily chart shows that DOGE has recovered from the integrated range of $0.068-$0.070. Since then, prices have formed higher lows along the rising blue trend line. The current market structure puts it near the $0.095 resistance zone.
The chart also shows that there was a sharp breakthrough at the end of August accompanied by increased trading volume. DOGE then hit the $0.10 area, but immediately faced selling pressure. Prices subsequently corrected, but remained above the uptrend line.
Details of the four-hour structure further depict the latest recovery process. Friday's decline driven by employment data pushed DOGE to basic support at $0.083. Six relatively stable K-lines then stabilized in the region, before buying returned.
Kinetic energy supports the current structure
DOGE then soared from approximately $0.0876 to $0.0952. This trend also pushed prices back above the $0.088 resistance level. This area has now become an immediate support area after a breakthrough.
The nine-day EMA on the daily chart is at approximately $0.08842. Current prices are still above this short-term moving average, so the latest market structure retains positive short-term momentum.
According to the chart provided, as of writing, the daily RSI reading was 63.51. This reading shows strong kinetic energy, but has not yet reached traditional extreme levels. In addition, the RSI rebounded strongly from weaker levels during the summer consolidation period. Early bullish RSI divergence signals appear near the lower range of the market, and these signals signal a stronger recovery visible on the daily chart. Subsequent price movements strengthened the emerging momentum structure.
$0.095 resistance determines the next move.
Market data provided showed that DOGE's 24-hour trading volume reached US$1.46 billion. This trading volume accounted for approximately 10.26% of the reported market value. At the same time, DOGE's reported market value is $14.25 billion.
Based on the chart provided, the immediate resistance level is still around $0.095. If we can continue to break through this area, the psychological barrier of $0.10 will be exposed. DOGE had previously been rejected at this threshold during its gains earlier in August.
The current structure presents two clear technical paths. If you hold $0.088, the recent breakthrough will be technically supported; if you lose this level, the market may turn into a false breakthrough.
As of writing, DOGE is still between support and main resistance.$ The 0.088 level controls the real-time structure from below. Above it,$0.095 and $0.10 provide the next key technical checkpoint.