Exchange Ranking
 Top Exchanges
 24h Volume Ranking
 Popularity Ranking
 Exchange BTC Balance
 Proof of Reserves
 Decentralized Exchanges
 Funding Rate
 Funding Heatmap
 Liquidation Data
 Max Pain
 Long/Short Ratio
 Whale L/S Ratio
 Binance/Okex/Huobi L/S
 Bitfinex Margin L/S
 ETF Tracker
 Solana ETF
 XRP ETF
 Hong Kong ETF
 Bitcoin Treasuries
 Crypto Reversal
 Ethereum Reserves
 HyperLiquid Wallet Analysis
 Hyperliquid Whale Watch
 Large Transactions
 On-chain Movement
 Bitcoin ROI
 Stablecoin Market Cap
 Options Analysis
 News
News Articles
 Economic Calendar
 Features
 Wallet
 Contract Calculator


 Security
 Collections
 Watchlist
 Following
 SHIB
SHIB Shiba Inu Price Forecast: Why SHIB is consolidating near resistance
Shiba Inu (SHIB) has been trading in the rising channel of the daily chart for several months, and prices are now approaching the upper boundary of the structure. This squeeze itself is not the whole story. The key lies in the trend after the breakthrough. The rise was not supported by new listing news or partnership announcements, only a slow push up, shrinking transaction volume and a supply base that remains highly concentrated in a few wallets.
When the team combined the daily chart, holder distribution and liquidation data, one obvious feature emerged: it looked like a ready-to-go consolidation pattern rather than a confirmed breakthrough. What does the data reveal?
Key Points
- As of the latest snapshot (September 13, 2026, approximately 14:00 UTC), the trading price of SHIB is approximately $0.0000053, up approximately 1.16% in 24 hours.
- The daily chart remains in the rising channel, with prices close to the upper boundary. The RSI 14 reading is 52.19, which is in the neutral region.
- Despite the price increase, 24-hour trading volume fell to US$48.42 million, a drop of 36.79%. This divergence deserves close attention.
- Liquidation volumes remained low, but in the past 24 hours, shorts suffered greater losses at $6930, compared with bulls at $3190.
- The circulation supply is approximately 589.23 trillion SHIB, and the total supply and maximum supply are both close to 589.5 trillion.
- Holder data shows a high degree of concentration: the top ten wallets hold 82.73% of the supply, while whale wallets alone control 94.78%.
Token contract information
Contract address: 0x95 ad61b0a 150d 79219dcf 64e1e6cc 01 f0b64c4ce
Standard: ERC-20
Chain: Ethereum
Current market conditions for SHIB
According to CoinMarketCap's SHIB list, the recent trading price of SHIB was approximately $0.0000053, up approximately 1.16% in the past 24 hours. The 24-hour trading range ranges between a low of $0.000052 and a high of $0.000054. The range of fluctuations is narrow, and there has been no significant turmoil yet. The market value is approximately US$3.1 billion, and the unlocked market value is almost the same.
It is worth noting that volume tells a different story than price. The 24-hour trading volume was only US$48.42 million, a significant decrease of 36.79% from the previous trading day. The ratio of trading volume to market value is only 1.55%, and liquidity relative to market value is even thinner at only 0.14%.
The total supply is 589.49 trillion SHIB, the maximum supply limit is 589.55 trillion, and the circulating supply is 589.23 trillion SHIB (verified online). The historical high price of $0.00008845 was set on October 28, 2021, about five years ago. Current prices are more than 94% below their peak. The lowest historical price of $0.000000000816 appeared on August 27, 2020.
Analysis of the reasons for today's SHIB price increase
Prices are rubbing at the top of the channel they have maintained for months, with an RSI 14 reading of 52.19 showing stable but not aggressive momentum. Buyers are not rushing to enter, but sellers are not dominant either. The decline in trading volume is particularly important here. A price rise in a context of shrinking trading volume usually indicates weak market confidence rather than a confirmed breakthrough. This model is worth considering in this week's "Dogecoin vs Shiba Inu" comparison in the meme sector.
Technical Analysis: Daily Chart
On Binance's daily SHIB/USDT chart, prices trade in a well-defined rising channel, with EMA9 at the trading level of $0.0000526, slightly below the current price. 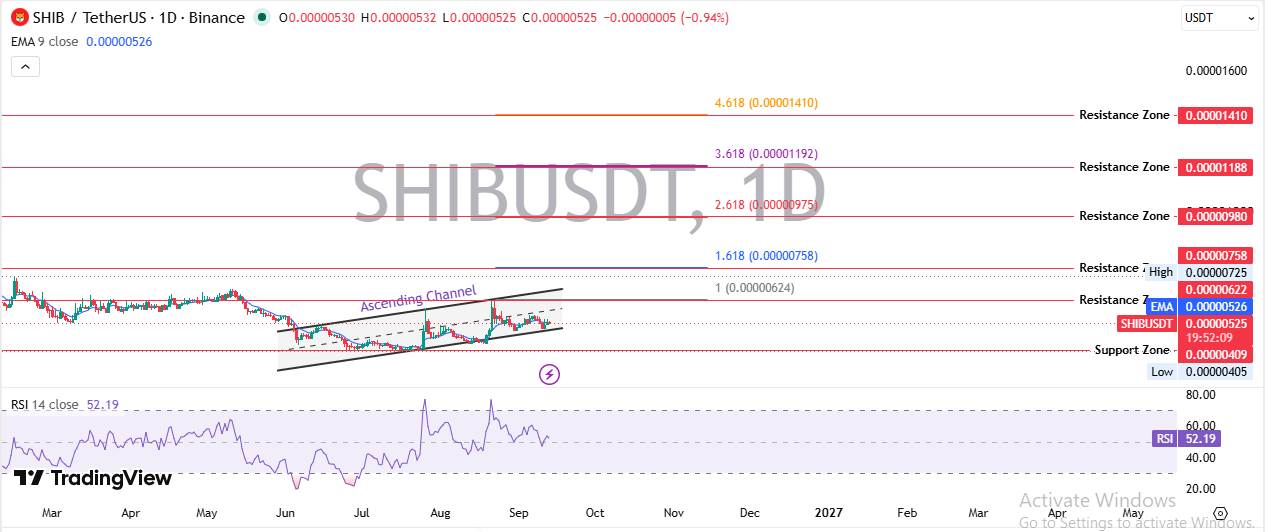 RSI 14 reads 52.19 and is in absolute neutral position. Neither buy nor sell.
Resistance is layered above the current trading price. The first line of defense is located at $0.0000622, followed by $0.0000725, and then the stronger area of $0.0000758. Beyond these levels, Fibonacci expansion levels mark larger targets: $0.0000980 at the 2.618 level,$0.00001188 at the 3.618 level, and $0.00001410 at the 4.618 level.
Support and Resistance Snapshot (Daily)
Level price resistance 4$0.0001410 resistance 3$0.0001188 resistance 2$0.0000980 resistance 1$0.0000758 recent resistance $0.0000622 Current price $0.0000530 Support 1$0.0000409 Support 2$0.00000405 Support level is quite far from the current trading price. This gap provides breathing room for the channel until a real disruptive signal appears on the chart, a structure similar to the structure previously noted in the "SHIB Bullion Resistance Signals."
Real-time clearing data
Breaking News: Clearing data remains low in all time frames, but the allocation between long and short is worth examining.
- In the past hour,$1730 was cleared. Among them, the bulls lost $1720, and the bears only lost $16.16.
- In the past four hours, the total liquidation amount reached US$3610. Within twelve hours, that figure climbed to $4550.
- Liquidation rose to $10110 in the past 24 hours, with long losses of $3190 and short losses of $6930. Within the daily window, bears suffer greater losses, which is reversed with shorter time frames.
Token Economics and Holder Concentration
Holder data indicates significant concentration at the top, which can be seen on the Etherscan Token Contract page. The total number of holders varies from source to source. CoinMarketCap lists about 3.08 million holders, while Etherscan itself counts about 1,649,042. Anyone evaluating a position should check both data at the same time.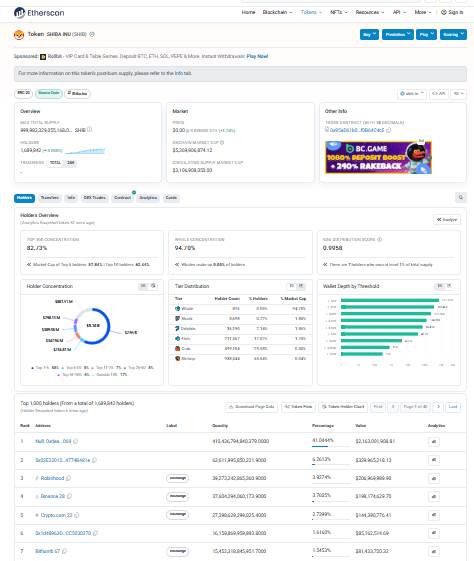
Concentration is very severe. The top ten holders control 82.73% of the tracking supply. The whale concentration reading is 94.78%, meaning that almost all supply is in the hands of big wallets. But the original numbers hide part of the truth. The largest single wallet holding more than 412 trillion coins (approximately 41% of the total) is burning or reserve addresses rather than active whale accounts.
Other than that, the situation has changed. Robinhood's managed wallet holds nearly 6.26%, Binance's cold wallet holds nearly 3.42%, and Crypto.com holds approximately 2.8%. These are exchange-managed wallets that hold tokens on behalf of many retail users, rather than a single accumulator. Does this leave a significant amount of actual concentration risk unaccounted for? Not as much as the title numbers suggest, although not zero either.
Liquidity and Exchange Volume
Liquidity relative to market value is only 0.14%, which is relatively thin for a token of this size, and trading volume is spread across nine locations rather than concentrated in one place. LBank leads the heat chart, followed by OKX and MEXC.
Volume by Exchange
Exchange 24-hour trading volume LBank $8.27MOKX $6.96MMEXC $4.29MBBitget$3.10MCoinbase$1.59MBBitunix$1.53MKuCoin$1.22MGate $1.17MWhiteBit$901.44K Dispersing liquidity among nine venues like this usually means that there is no single exchange alone driving prices. This pattern was also confirmed in the recent "361 billion SHIB exit Korea" report on changes in regional flows.
Bull, benchmark and bear market scenarios
This is not a financial recommendation. These scenario estimates are built based on the current chart structure rather than guarantees.
Bullmarket scenario:
Daily closing above $0.00000622 opens a path to $0.0000758 over a time span of 7 to 14 days. The probability is about 30%, depending on whether volume returns as prices rise. Failure condition: Daily closing price is less than $0.0000480.
Baseline scenario:
In the next 7 to 30 days, prices will continue to consolidate between $0.0000480 and $0.0000622, waiting for the channel to decide on the next move, in line with the pattern covered in "Bulls Control Stability of Outflows". The probability is the highest, about 45%. Failure condition: Clear breakthrough of either boundary when trading volume increases.
Bear market scenario:
The channel breaks downward and prices re-test the support area near $0.0000409. If sentiment weakens, it may move further towards $0.0000405 within 30 days. The probability is about 25%. Expiration condition: Trading above $0.0000560 for more than one week.
Price forecast table
Time frame Bear market benchmark bull market 24 hours $0.000051 $0.000053 $0.0000567 days $0.000048 $0.000055 $0.000006230 days $0.000040$0.000058$0.00075 Long-term (2026)$0.000030$0.00070$0.0000120 These ranges are built around the levels of support and resistance already on the chart, rather than deterministic forecasts.
Key risks
- Price rises are accompanied by falling volume: This is the primary risk. This is a mixed signal that may reverse at any time.
- Whale concentration: Although most of it can be traced to burning addresses and exchange custody, this remains a long-term structural concern.
- Liquidity is thin: Liquidity relative to market value is only 0.14%, which may cause two-way fluctuations to be more intense than usual.
- Overall sector volatility: Sector-wide volatility can overwhelm any individual token chart setting, so this pattern is worth reading in conjunction with broader cryptocurrency price movements (including the cases presented in "Why This Setting Can Define the Month") rather than viewed in isolation.
Disclaimer : This article is for reference only and does not constitute financial, investment or trading advice. The cryptocurrency market is highly volatile. Readers should conduct independent research and consult a licensed financial adviser before making any investment decisions.