Exchange Ranking
 Top Exchanges
 24h Volume Ranking
 Popularity Ranking
 Exchange BTC Balance
 Proof of Reserves
 Decentralized Exchanges
 Funding Rate
 Funding Heatmap
 Liquidation Data
 Max Pain
 Long/Short Ratio
 Whale L/S Ratio
 Binance/Okex/Huobi L/S
 Bitfinex Margin L/S
 ETF Tracker
 Solana ETF
 XRP ETF
 Hong Kong ETF
 Bitcoin Treasuries
 Crypto Reversal
 Ethereum Reserves
 HyperLiquid Wallet Analysis
 Hyperliquid Whale Watch
 Large Transactions
 On-chain Movement
 Bitcoin ROI
 Stablecoin Market Cap
 Options Analysis
 News
 Articles
 Economic Calendar
 Features
 Wallet
 Contract Calculator


 Security
 Collections
 Watchlist
 Following
 PUMP
PUMP 24小时内下跌4.9%,但仍处于日线上升趋势线上方
这一 Pump.fun 价格预测始于“弱势单日表现”与“完好的上升趋势”之间的张力。Pump.fun 是一个基于 Solana 区块链的平台,允许用户发布和交易模因币(memecoins)。$PUMP 是其原生代币。
该代币在9月中旬从接近 $0.0035 的低点反弹,至10月初达到近 $0.006815 的高点。目前它正回调至趋势线支撑位附近。
今日 Pump.fun 价格为 $0.005662,过去24小时下跌4.9%。该代币的交易区间在 $0.005293 至 $0.006191 之间,市值为26.26亿美元,排名第四十三位。
指标数值 价格$0.005662 24小时变化-4.9% 24小时范围$0.005293 - $0.006191 市值26.26亿美元 排名#43 数据来源:市场数据取自 CoinMarketCap,截至2026年10月9日。不同追踪网站的数据可能略有差异。
Pump.fun 技术分析
日线图显示,自9月低点以来,$PUMP 形成了更高的低点。一条上升的趋势线连接了这些低点,并一直有效。
10月8日,一根大的红色阴线将价格跌至趋势线位置。其下影线略微跌破0.005384的支撑位,随后买家将价格推回。
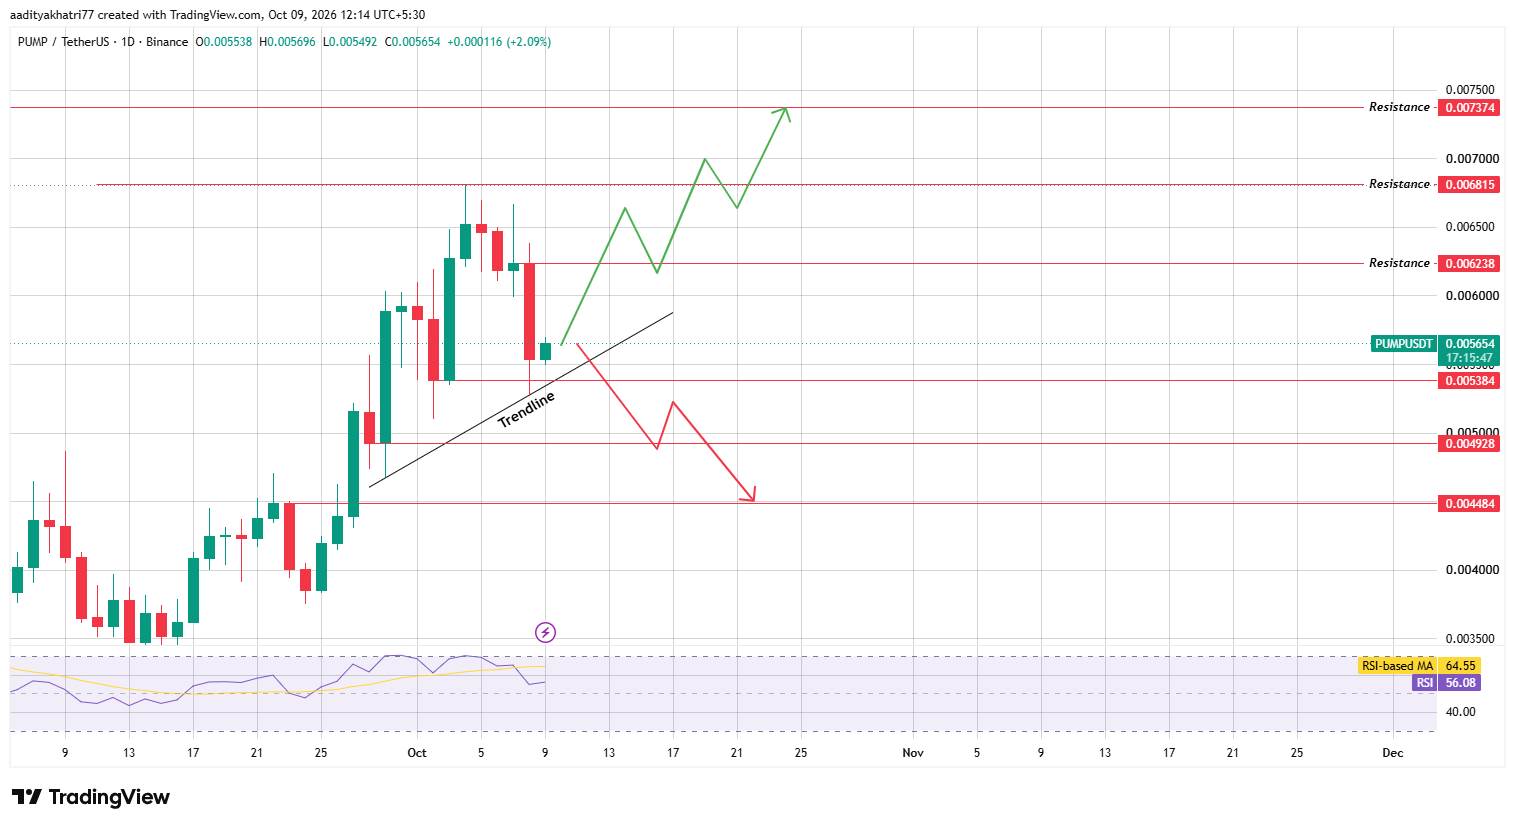 来源:数据取自 TradingView
当前的日线蜡烛上涨2.09%,将于10月10日印度标准时间05:30(协调世界时00:00)收盘。
相对强弱指数(RSI)为56.08,低于其移动平均线64.55。在经历反弹后,动能有所冷却,但读数既未超买也未超卖。
因此,我们的技术观点等待价格和成交量确认下一步走势。
Pump.fun 价格预测:$PUMP 能否突破阻力?
看涨情形始于趋势线的持稳。只要 $PUMP 保持在0.005384的支撑位及趋势线上方,买方就掌握控制权。
如果日线收盘价高于0.006238的阻力位(比图表价格0.005654高约10.3%),且成交量高于20日均量,这将是首个确认信号。
若此信号成立,图表指向0.006815,较当前水平高出约20.5%。这是近期的波段高点。
若日线收盘价突破0.006815,将为走向0.007374打开道路,涨幅约为30.4%。
在低成交量下的突破往往容易失败,因此成交量的重要性不亚于价格。
如果趋势线被打破,$PUMP 会怎样?
看跌情形始于日线收盘价低于上升趋势线及0.005384的支撑位(比图表价格低约4.8%)。
这种收盘将破坏更高的低点结构。从下方对已破裂趋势线的弱势回测将进一步确认这一趋势。
The price may then drift towards 0.004928, a drop of about 12.8%. If it closes below this level, it points to 0.004484, a decrease of about 20.7%.
The cooling RSI has increased caution as it has not yet recovered.
Key Price Observation
The following prices are from daily charts and are based on closing prices:
Support resistance 0.0053840.006238 0.0049280.006815 0.0044840.007374 Bullish, benchmark and bearish scenarios
Scenario setting conditional target level Bullish daily closing above 0.006238, then above 0.006815, And volume was above average 0.006815 - 0.007374 Benchmark prices were running above the trend line between support and first resistance 0.005384 - 0.006238 The bearish daily closed below the trend line and the 0.005384 support, and selling volume increased 0.004928 - 0.004484 Pump.fun Compared with Bitcoin
In the past 24 hours,$PUMP fell 4.9% against the US dollar and 4.9% against Bitcoin. Simple arithmetic shows that Bitcoin is basically flat in dollar terms.
As a result, the decline was due to $PUMP itself, rather than a broader market sell-off. Stable Bitcoin helps $PUMP hold at 0.005384; while a sharp decline in Bitcoin could pull it towards lower support.
Methodology
This Pump.fun price forecast uses two input sources. Price, rising trend line and RSI data are from the daily chart of Binance $PUMP/USDT on TradingView, collected at 12:14 Indian Standard Time on October 9, 2026. Market data comes from CoinMarketCap snapshots.
Chart price of 0.005654 is slightly different from CoinMarketCap price of $0.005662. These two sources use different time windows.
Chart candle has risen 2.09% since 00:00 UTC, while CoinMarketCap shows a rolling 24-hour decline of 4.9%. We use chart prices to calculate percentage distance.
We only accept breakthroughs or breaks when the daily candle closes and the volume is above the 20th average volume. This average is our own confirmation criterion and does not come directly from the chart. Since there is no clearing or exchange volume data, it will not be used.
Expert opinion
General market commentary on uptrend lines believes that they show a healthy uptrend, but closing prices below this line usually signal a shift of control.
When applied to $PUMP, this view tends to be patient. If the daily closing price is higher than 0.006238 in strong trading volume, it will benefit the buyer.
If the closing price is below 0.005384 and the trend line, it will benefit the seller. Prices tend to follow demand and volume, so confirmation is more important than forecast.