Exchange Ranking
 Top Exchanges
 24h Volume Ranking
 Popularity Ranking
 Exchange BTC Balance
 Proof of Reserves
 Decentralized Exchanges
 Funding Rate
 Funding Heatmap
 Liquidation Data
 Max Pain
 Long/Short Ratio
 Whale L/S Ratio
 Binance/Okex/Huobi L/S
 Bitfinex Margin L/S
 ETF Tracker
 Solana ETF
 XRP ETF
 Hong Kong ETF
 Bitcoin Treasuries
 Crypto Reversal
 Ethereum Reserves
 HyperLiquid Wallet Analysis
 Hyperliquid Whale Watch
 Large Transactions
 On-chain Movement
 Bitcoin ROI
 Stablecoin Market Cap
 Options Analysis
 News
News Articles
 Economic Calendar
 Features
 Wallet
 Contract Calculator


 Security
 Collections
 Watchlist
 Following
 BTC
BTC After Wall Street opened on Tuesday, U.S. stocks rebounded despite geopolitical pressure, with Bitcoin (BTC) hitting $65,000.
Highlights
Bitcoin hit US$65,000 for the first time since August 10, as risky assets respond to new signals from the United States and Iran.
Analysis warns that the yield on U.S. 30-year Treasury bonds has soared, reaching 5.34%, a 29-year high.
Bitcoin price analysis points out that the top-shoulder-bottom pattern is facing a decision moment.
Trump called the Strait of Hormuz "open" and Bitcoin's trend deviated from the U.S. stock market.
Bitcoin diverges from U.S. stocks, with Trump calling the Strait of Hormuz "open"
Data from TradingView showed that BTC/USD extended this week's gains, while the S & P 500 rebounded from 7,696 points (its lowest level since August 4). 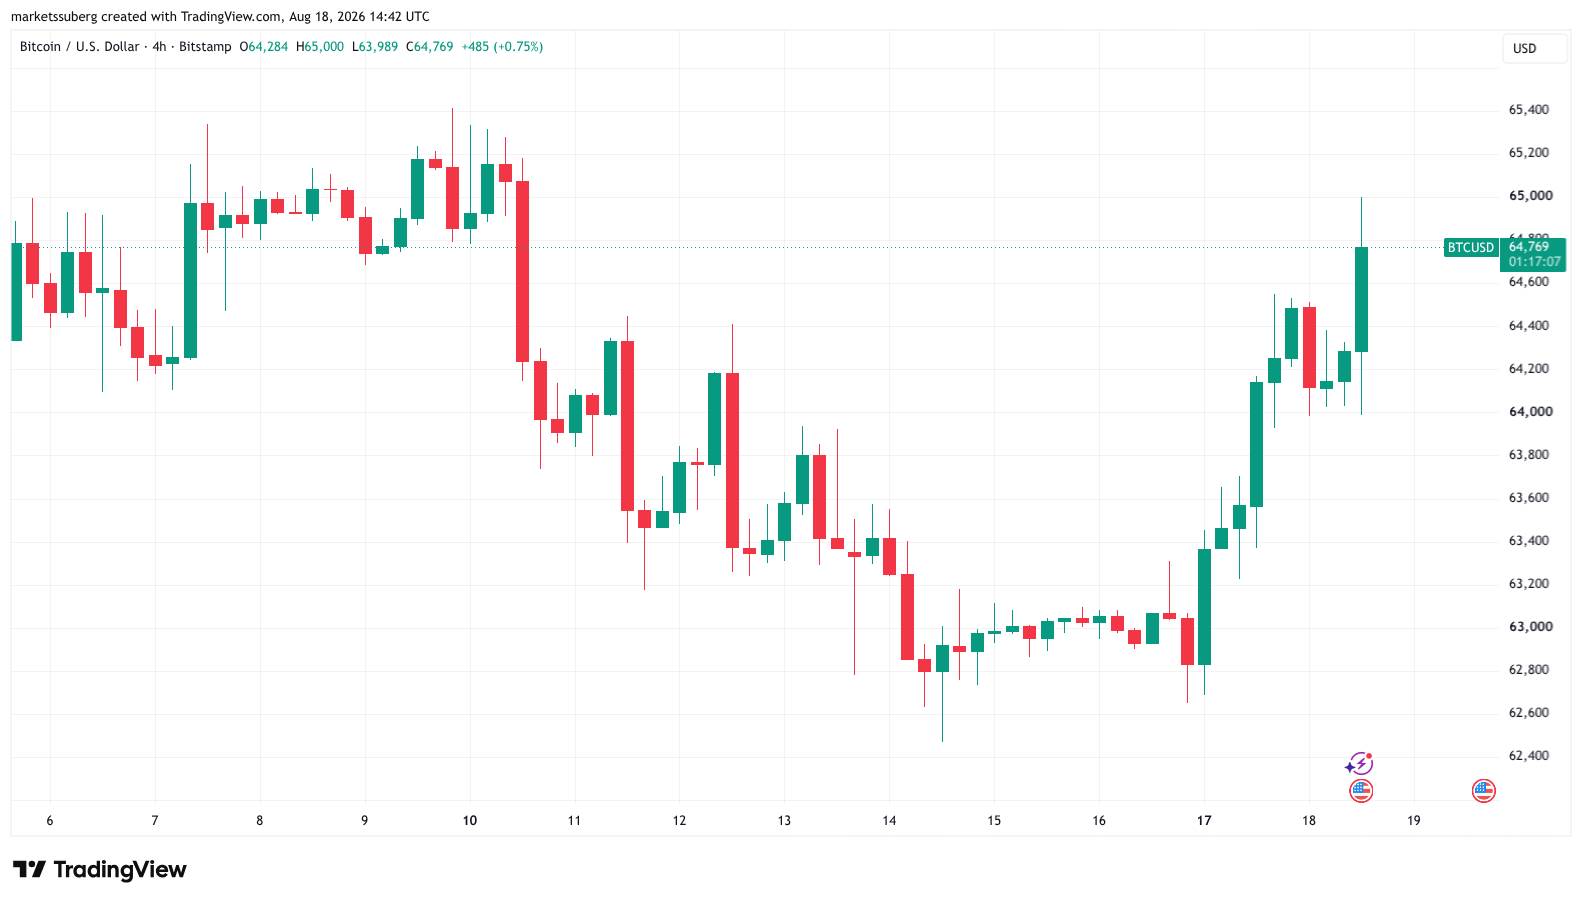 Four-hour chart of BTC/USD
Previously, U.S. President Donald Trump released a map of the closed Strait of Hormuz oil route marked "New U.S. Territory" on Truth Social. The United States and Iran both claim control of the Strait of Hormuz, and Trump has threatened military action against U.S. ally Oman over its plans to cooperate with Iran to collect tolls on shipping. In a subsequent post, Trump confirmed that there would be no further diplomatic dialogue with Iran. He wrote: "There are no ongoing or planned talks or dialogues with the Islamic Republic of Iran. The maritime blockade remains fully in effect. The Strait of Hormuz is open and operates normally. All mines have been removed or detonated." 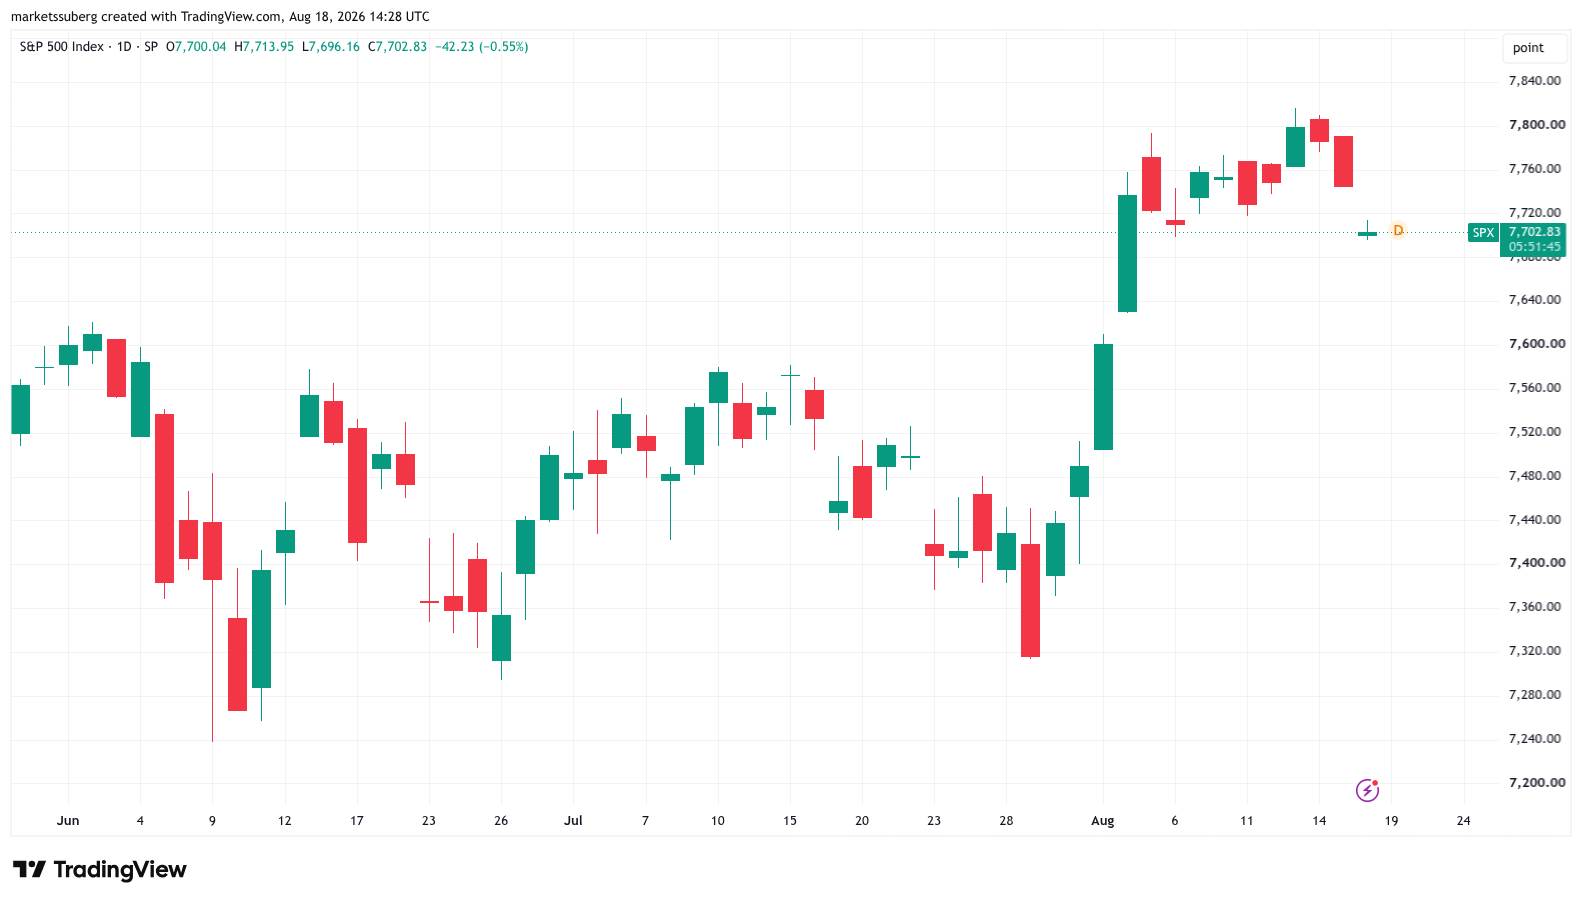 One-day trend chart of the S & P 500 Index
As on Monday, oil prices did not fluctuate significantly, with WTI crude falling 1% to $84 a barrel. U.S. Treasury bonds continued to be under pressure, with the 30-year yield rising to 5.34%, the highest level since January 2007. Bank of New York Mellon analyst Jeff Yu pointed out in a research note that "bond prices are issuing warnings." He said yields surged because "investors demanded higher compensation for inflation risks" and also attributed the rise to government borrowing. 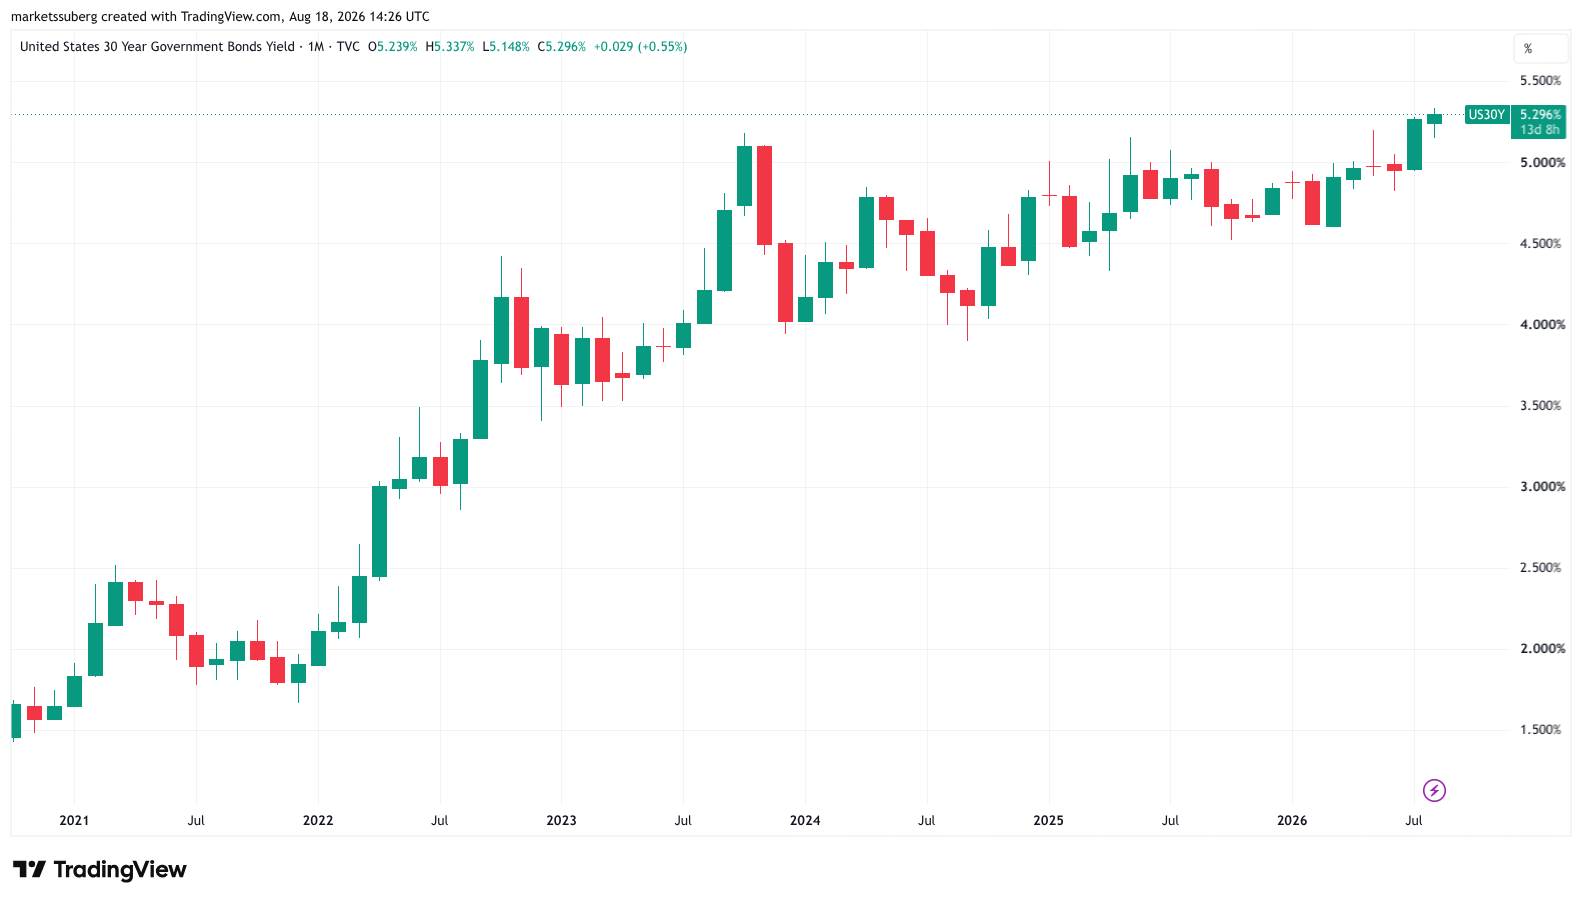 January chart of U.S. 30-year Treasury yields
BTC prices face critical rebound test
Trader and analyst Axel Kibar updated his view on BTC/USD on Platform X, pointing out that a potential reverse head-and-shoulder pattern is forming at US$62,300. "If BTC/USD is going to rebound, it has to start here," he said on Monday. Kibar's target price is: if the head-and-shoulder pattern fails, it may fall to US$53,000; if the rebound continues, the upside target can reach US$76,000.
One-day trend chart of BTC/USD
It has been previously reported that underwater investors are one of the reasons why Bitcoin cannot break through higher prices. When Bitcoin rebounded to $64,500, it also failed to break through the upper trend line, the 50-month exponential moving average (EMA). The moving average is currently at $65,827, constituting resistance.