Exchange Ranking
 Top Exchanges
 24h Volume Ranking
 Popularity Ranking
 Exchange BTC Balance
 Proof of Reserves
 Decentralized Exchanges
 Funding Rate
 Funding Heatmap
 Liquidation Data
 Max Pain
 Long/Short Ratio
 Whale L/S Ratio
 Binance/Okex/Huobi L/S
 Bitfinex Margin L/S
 ETF Tracker
 Solana ETF
 XRP ETF
 Hong Kong ETF
 Bitcoin Treasuries
 Crypto Reversal
 Ethereum Reserves
 HyperLiquid Wallet Analysis
 Hyperliquid Whale Watch
 Large Transactions
 On-chain Movement
 Bitcoin ROI
 Stablecoin Market Cap
 Options Analysis
 News
News Articles
 Economic Calendar
 Features
 Wallet
 Contract Calculator


 Security
 Collections
 Watchlist
 Following
 BTC
BTC Bitcoin's market sentiment index rose above 89, hitting a new high since March 2024, before falling back.
The market sentiment index tracked by CryptoQuant analyst Darkfost has climbed above 89, reaching its highest level since March 2024, before falling slightly.
Sentiment indicators briefly entered the "extreme greedy" range
Darkfott's sentiment indicators briefly entered the "extreme greedy" range during Bitcoin's recent rally. The analyst said the reading subsequently cooled as Bitcoin tried to maintain its current price.
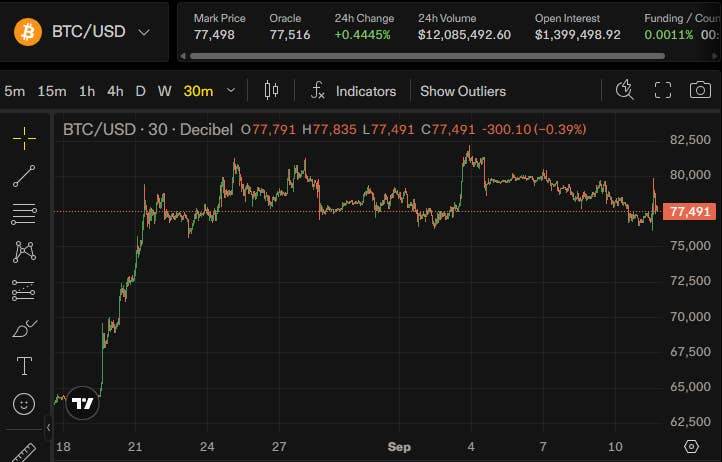
According to CoinGecko data, Bitcoin's trading range in the past 24 hours is approximately US$76,400 to US$79,600, with a price close to US$77,300. At the same time, the U.S. spot Bitcoin ETF recorded a net outflow of $462.7 million during the trading week from September 8 to 11.
CryptoQuant analyst Darkfost pointed out that the last time a similar burst of market bullish sentiment occurred in March 2024. As the price of Bitcoin rose, his indicator briefly broke through the 89-point mark of 100, entering the range he described as "extreme greed." According to Darkfost, although Bitcoin is trying to stabilize the current price, the reading has fallen back from its peak. He warned that unusually optimistic or pessimistic readings deserve close attention because they tend to appear near market turning points. This observation is intended to alert potential risks rather than conclude that Bitcoin has begun to reverse trend.
Market sentiment cools from high
Darkfost compared this situation to March 2024, referring to specific sentiment indicators cited in its posts. The indicator combines Fear & Greed Index data with other input variables, so a reading above 89 should not be misinterpreted as the current common value for all cryptocurrency sentiment indices.
For comparison, the independent Fear and Greed Index released by Alternative.me was at 63 at the time of verification of this report, which belongs to the "greedy" range. The page shows that the reading was 56 the previous day, 73 a week ago, and 29 a month ago. Alternative.me said its index is compiled based on data such as Bitcoin volatility, trading momentum and volume, social media activity, Bitcoin's share of the crypto market, and search trends.
These two readings serve different purposes in the narrative: Darkfost's data describes the highs reached by the indicators he tracks; while Alternative.me's data provides another independent snapshot of market sentiment. Neither of these readings reflects the specific trading volume of Bitcoin investors, nor does it provide a clear price target.
Darkfost also distinguishes between sentiment during a sustained bear market and sentiment during a price shift. He noted that negative readings can last for a long time when markets are weak. Extreme readings are more valuable to monitor when investor behavior changes with price changes, although his post did not specify specific dates or price points at which Bitcoin could turn.
Bitcoin transactions fall below recent test highs of US$80,000
At the time of the latest CoinGecko price check, Bitcoin was trading at close to $77,300. The platform showed a 24-hour low of around $76,393 and a high of around $79,607, with current prices well below the top of the day's range. Real-time prices and rolling ranges may change before release.
Price movements provide context for Darkfost's view that "Bitcoin is trying to maintain levels while emotions are cooling." Since market data does not show when its index reaches a high point, these data should not be used to claim that specific intraday movements have led to high readings above 89 points.
Recent crypto news reports track price levels during the pullback. A Bitcoin technical report on September 10 showed that the price fell below US$78,000, when the daily Bollinger Band was at approximately US$76,392, the middle Band was at approximately US$78,650, and the upper Band was at approximately US$80,907. These are chart readings from September 10 and not new calculation levels for the current session.
Analysts told the media earlier this week that Bitcoin prices could remain below $82,000 until the Federal Reserve's next decision. In a report on September 7, CoinEx chief analyst Jeff Ko pointed out that support is around $78,000-$79,000 and resistance is around $82,000. Bitcoin's subsequent fall below $78,000 means that the previously quoted support range has been tested; therefore, Ko's previous levels need to be interpreted in the context of their publication.
The same September 7 report noted that the U.S. spot Bitcoin ETF absorbed approximately $986.9 million in funds in the previous trading week, bringing total net inflows to approximately $3.8 billion for three consecutive weeks. Ko said he would like to see further capital inflows during the sideways consolidation period of Bitcoin before he could call it continued accumulation activity. However, fund data for the following week gave different results.
U.S. Bitcoin ETF fund flows turned negative
According to Farside data (reported on Saturday), during the trading week from September 8 to 11, U.S. -listed spot Bitcoin ETFs recorded a net outflow of $462.7 million. In the four trading days after U.S. markets closed for Labor Day on Monday, September 7, the funds reported net losses.
The largest single-day withdrawal amount was US$282.7 million on Thursday. Net outflow narrowed to $13.2 million on Friday. ARKB, a subsidiary of ARK21 Shares, became the largest decline in a single bitcoin fund in mid-week, recording a loss of $234.2 million. BlackRock's IBIT posted a net loss of $52.5 million over four trading days.
Money flows provide another indicator for U.S. investors that can be referenced side by side with Darkfost's sentiment readings, although they track different activities. Farside's data measures net purchases and redemptions of listed products and does not determine whether specific ETF holders directly buy and sell bitcoins. In addition, a single week's net outflow alone cannot explain price fluctuations on a given day.
Inflation data enters, Federal Reserve meeting is imminent
On the eve of the Federal Reserve meeting, inflation data also entered the market's view. The August Consumer Price Report released by the U.S. Bureau of Labor Statistics on September 11 showed that prices rose by 3.4% in the past 12 months, unchanged from the annual rate in July. Core prices excluding food and energy rose 0.3% month-on-month in August and 2.4% year-on-year.
The Fed's calendar shows that its next policy meeting is scheduled for September 15 - 16. The date of the meeting has been confirmed, but its final decision and subsequent impact on Bitcoin prices remain unknown.