Exchange Ranking
 Top Exchanges
 24h Volume Ranking
 Popularity Ranking
 Exchange BTC Balance
 Proof of Reserves
 Decentralized Exchanges
 Funding Rate
 Funding Heatmap
 Liquidation Data
 Max Pain
 Long/Short Ratio
 Whale L/S Ratio
 Binance/Okex/Huobi L/S
 Bitfinex Margin L/S
 ETF Tracker
 Solana ETF
 XRP ETF
 Hong Kong ETF
 Bitcoin Treasuries
 Crypto Reversal
 Ethereum Reserves
 HyperLiquid Wallet Analysis
 Hyperliquid Whale Watch
 Large Transactions
 On-chain Movement
 Bitcoin ROI
 Stablecoin Market Cap
 Options Analysis
 News
News Articles
 Economic Calendar
 Features
 Wallet
 Contract Calculator


 Security
 Collections
 Watchlist
 Following
 LTC
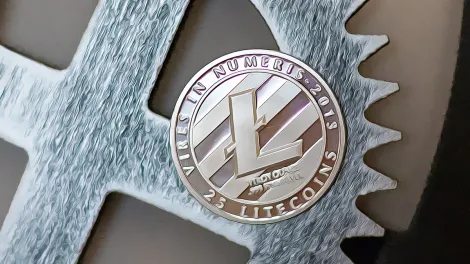
LTC Litecoin's online activity has increased significantly, and the average daily economic aggregate is close to US$1 billion.
Recently, Litecoin's online activity has increased significantly, and the adjusted economic aggregate has reached US$1 billion in a few days. Although the number of transactions on the chain has increased, the price of Litecoin still shows certain volatility. Currently, its trading price is about US$60.78, down 3.49% during the day. In the past 24 hours, the highest price hit $64.64, highlighting the current level of resistance the cryptocurrency faces.
Technical analysis points to key thresholds
Market data shows that Litecoin rose from a low range of just over $50 in early September, breaking through the previous resistance level of $56.13. This level has now become a key support point for traders to monitor downside risks. If Litecoin can remain above $56.13, market attention may shift to resistance above $64.64. If it breaks below this support level, the price may accelerate its decline to the next key level of $48.42.
Technical indicators send mixed signals. On the daily chart, the Relative Strength Index (RSI) is 68.07, slightly below the overbought threshold of 70 and above the average of 63.56. The Moving Average Convergence Divergence Indicator (MACD) line is at 2.85, above the signal line of 2.12, and the histogram reading is positive 0.74, reflecting continued upward momentum.
While these indicators hint at potential bullish trends, market observers point out that price momentum may slow as technical levels approach. Monitoring the RSI becomes particularly important in this case, as entering overbought areas may prompt traders to take a cautious attitude.
According to the Litecoin Foundation,"In 24 hours, the value of more than 17 million Litecoin (approximately US$1 billion) was transferred on the Litecoin network." The foundation added that although the latest data highlighted a strong on-chain value shift, the adjusted economic aggregate peak in May reached $2.51 billion in 24 hours.
Derivatives market activity intensifies
In the derivatives field, the volume of open interest in Litecoin contracts continues to rise. CoinGlass reported that open interest volume increased from approximately $370 million in mid-September to more than $500 million on September 22. Trading volume has also increased, with recent transaction amounts ranging from US$680 million to US$730 million, one of the highest levels observed in Litecoin this year.
High open interest volumes usually indicate more active positions in the market, although this indicator by itself does not indicate whether traders overall are bullish or bearish. The combination of increased open interest volume and strong trading volume supports the current bullish tone despite the recent correction.
On-chain adoption and meme token focus
In addition to derivatives, DeFiLlama's data shows that as September draws to a close, Litecoin's total lock-in value (TVL), number of active addresses and transaction counts remain high, indicating continued user interest.
与此同时,市场关注的激增也延伸到了快速演变的迷因代币领域。在这里,时机和代币的选择至关重要。例如,根据Fomo App的数据,“Niu Lai”的案例显示,初始投资99美元在几天内据报道增长至约37万美元。诸如Fomo App等平台使用户能够实时追踪代币发行、投资者交易和活动排名,帮助市场参与者警惕迷因代币领域中迅速转化为重大收益的新兴机会。
总体而言,莱特币的技术前景依然积极,网络活跃度、衍生品兴趣以及积极的动能为近期的价格走势提供了背景。目前的重点仍是莱特币能否守住56.13美元的支撑位,并挑战64.64美元的阻力位。
技术分析师强调,任何未能守住56.13美元支撑位的情况都可能将注意力引向48.42美元;而若能保持在64.64美元之上的动能,则可能引发新一轮的看涨情绪。