Exchange Ranking
 Top Exchanges
 24h Volume Ranking
 Popularity Ranking
 Exchange BTC Balance
 Proof of Reserves
 Decentralized Exchanges
 Funding Rate
 Funding Heatmap
 Liquidation Data
 Max Pain
 Long/Short Ratio
 Whale L/S Ratio
 Binance/Okex/Huobi L/S
 Bitfinex Margin L/S
 ETF Tracker
 Solana ETF
 XRP ETF
 Hong Kong ETF
 Bitcoin Treasuries
 Crypto Reversal
 Ethereum Reserves
 HyperLiquid Wallet Analysis
 Hyperliquid Whale Watch
 Large Transactions
 On-chain Movement
 Bitcoin ROI
 Stablecoin Market Cap
 Options Analysis
 News
 Articles
 Economic Calendar
 Features
 Wallet
 Contract Calculator


 Security
 Collections
 Watchlist
 Following
 BTC
Bitcoin is under pressure again: Global M2 indicators show that liquidity has not yet been reset and the bottom of the bull market cycle has not yet reached
Bitcoin is under pressure again today. Twice in the past few weeks, Bitcoin has failed to break the key resistance level of $87,000. The move provides analyst CryptoCon with another reason to revisit its bearish cycle argument. CryptoCon has always been skeptical of whether the new Bitcoin bull market has fully begun.
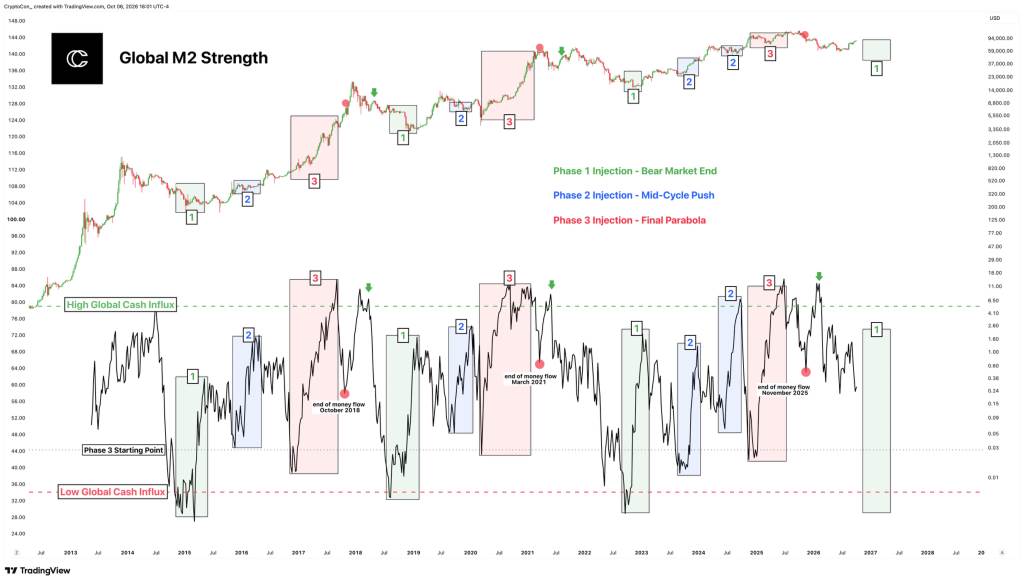
His latest argument is based on "Global M2 Strength," a liquidity-based indicator. Historically, this indicator has been surprisingly consistent with Bitcoin's major cycle conversion points. CryptoCon points out that current signals still do not show the reset characteristics typically associated with true cycle bottoms.
CryptoCon says global liquidity has not yet been reset
CryptoCon's chart divides global liquidity conditions into three phases:
- Phase 1: marks the end of the bear market and the beginning of a new round of liquidity injections.
- Phase 2: represents the driving force in the middle of the cycle.
- Phase 3: marks the final stage of liquidity expansion, which is often accompanied by a parabolic rise in the Bitcoin cycle.
His concern is that current global M2 intensity readings have not yet completed the sequence needed to launch the new first phase.
Source: X / @CryptoCon
Historically, the indicator will first fall below what he calls the "Low Global Cash Influx line" before bouncing back strongly upwards. This deep reset has occurred near the bottom of previous major bitcoins. However, CryptoCon said it has not yet seen this phenomenon.
Chart closely tracks past Bitcoin cycles
The lower half of the chart is the most critical part. CryptoCon marks several liquidity injections in previous cycles and compares them with Bitcoin price movements above.
- Green Zone (Phase 1): Appears near the end of major bear markets.
- Blue area (second stage): follows the middle part of expansion.
- Red area (third stage): appears near the last stage of the cycle.
CryptoCon believes a particularly important detail is the accuracy with which the indicator identifies the end points of previous capital flow stages. The red dots on the chart mark the end points of liquidity flows around October 2018, March 2021 and November 2025. These points closely align with major changes in Bitcoin's broader cyclical structure. It is this historical consistency that makes him reluctant to ignore current readings.
What signal can confirm the true bottom of the Bitcoin cycle?
For CryptoCon, the indicator still needs to meet two conditions:
- First, the global M2 intensity needs to fall below the "low global cash inflow" threshold at the bottom of the chart.
- 其次,它需要反转并强劲大幅上涨。
这一序列将类似于以往的第一阶段流动性注入,并给他带来更大的信心,证明新的比特币周期已经开启。他目前的图表将该潜在窗口预测至2027年。但这并不意味着比特币必须在那之前持续下跌,而是意味着他所关注的流动性信号尚未提供其传统的确认。
延伸阅读:“周日拉升=周一抛售”:分析师警告比特币下周可能回调
比特币反复拒绝87,000美元价位加剧了疑虑
CryptoCon发布此帖的时机值得注意。比特币在近几周内两次测试了87,000美元区域,但均未能确立持续的上涨势头。随后,随着整个加密市场走弱,价格再次回落。
单独的拒绝行为并不能证明牛市论点是错误的。但是,结合不完整的周期指标,这为CryptoCon的论点提供了更多证据,即最近的复苏可能仍处于最终宏观重置之前。这是其论点的核心区别:他并非主张比特币永远无法上涨,而是在质疑市场是否已经完成了一个持久的新牛市周期前通常看到的流程。
为何全球M2不同于典型的比特币指标
Another reason why CryptoCon likes this signal is that it comes from outside Bitcoin. RSI, realization price, SOPR or other on-chain indicators are usually directly linked to BTC prices and investor behavior. Global M2 attempts to measure the broader amount of money available in major economies. This gives it a different perspective.
More global liquidity may end up flowing to risky assets such as stocks and cryptocurrencies; less liquidity will make these markets more difficult to maintain. This is why CryptoCon views the indicator as another independent verification of its cyclical arguments.