Exchange Ranking
 Top Exchanges
 24h Volume Ranking
 Popularity Ranking
 Exchange BTC Balance
 Proof of Reserves
 Decentralized Exchanges
 Funding Rate
 Funding Heatmap
 Liquidation Data
 Max Pain
 Long/Short Ratio
 Whale L/S Ratio
 Binance/Okex/Huobi L/S
 Bitfinex Margin L/S
 ETF Tracker
 Solana ETF
 XRP ETF
 Hong Kong ETF
 Bitcoin Treasuries
 Crypto Reversal
 Ethereum Reserves
 HyperLiquid Wallet Analysis
 Hyperliquid Whale Watch
 Large Transactions
 On-chain Movement
 Bitcoin ROI
 Stablecoin Market Cap
 Options Analysis
 News
 Articles
 Economic Calendar
 Features
 Wallet
 Contract Calculator


 Security
 Collections
 Watchlist
 Following
 ADA
 LINK
 SOL
In the crypto market, some large altcoins are once again facing selling pressure. Analyst Ali Charts warned of downside risks to Chainlink (LINK), Cardano (ADA) and Solana (SOL). In the three relevant charts, completely different technical patterns are presented: LINK has a head-and-shoulder pattern, ADA encounters resistance from the uptrend channel, and SOL faces the risk of breaking the support level. The analyst pointed out that if certain key prices fall, all three major currencies may experience a deeper correction.
Is LINK at risk of falling to US$12.39?
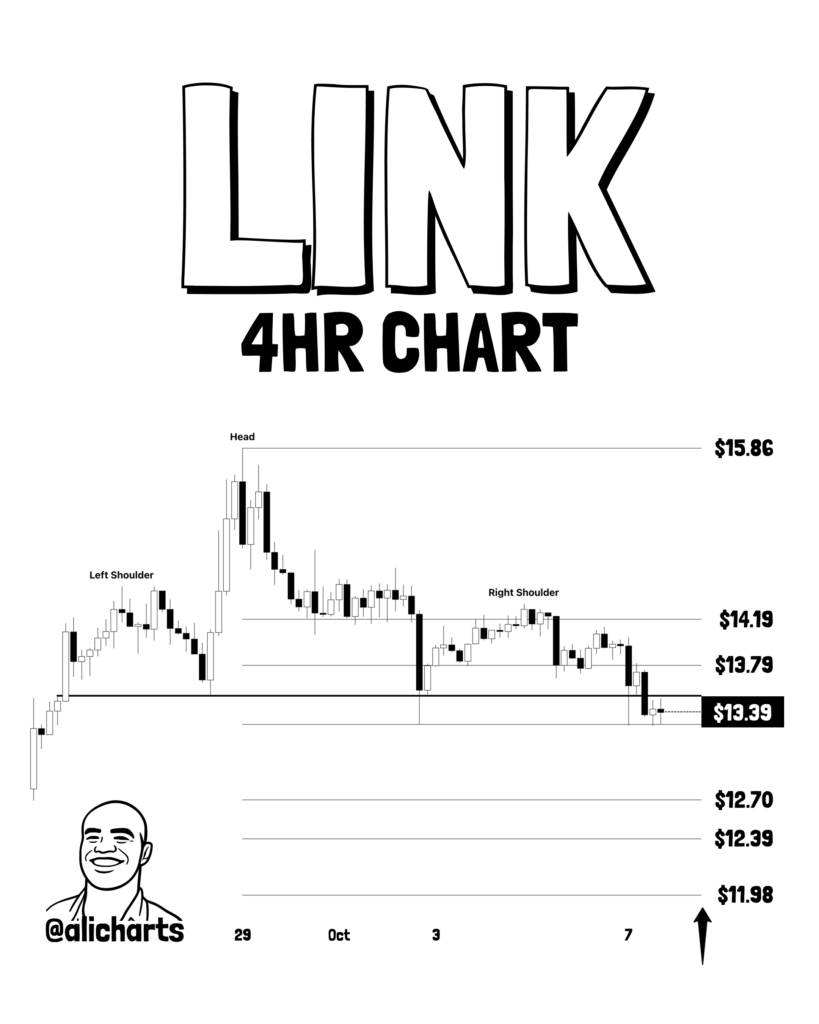
Ali Charts observed that Chainlink's price on the four-hour chart is approaching below the neckline of the head-and-shoulder pattern. According to analyst analysis, as long as LINK remains below US$13.56, the downside target for this pattern will take effect.
The chart shows that the current price of LINK is approximately US$13.39. In the head-and-shoulder structure, the head area is located near $15.86, while the downside targets point to $12.39 and then $11.98 respectively.
In Ali Charts 'scenario, whether it can remain below US$13.56 is the key. If selling pressure accelerates,$12.39 will become the primary target; if this position falls,$11.98 will become the next focus.
Will the ADA fall back to US$0.21?
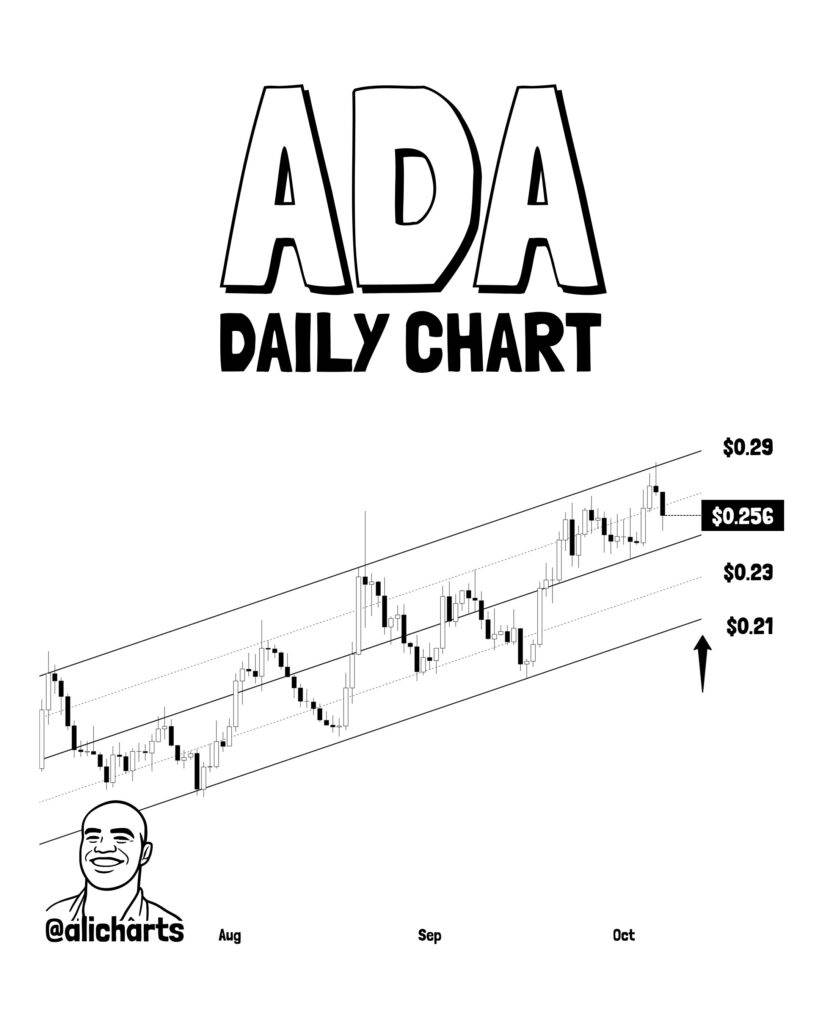
Cardano's technical side also showed signs of weakness. Ali Charts pointed out that the ADA was blocked on the daily line by the upper track of the rising channel.
Data shows that ADA is currently trading at approximately $0.256. The upper track of the channel is located around US$0.29, the lower track extends to US$0.21, and the middle area is around US$0.23.
Analysts believe that if resistance from the upper track continues, prices may seek support from the lower track of the channel, and US$0.21 will become the main tracking target at this time.
To achieve the ADA pullback towards US$0.21, selling pressure in the channel needs to continue to be maintained. The current trend shows that although the upward structure has not yet been completely destroyed, the bulls have shown signs of fatigue in the upper track region.
What will happen if Solana falls below $117?
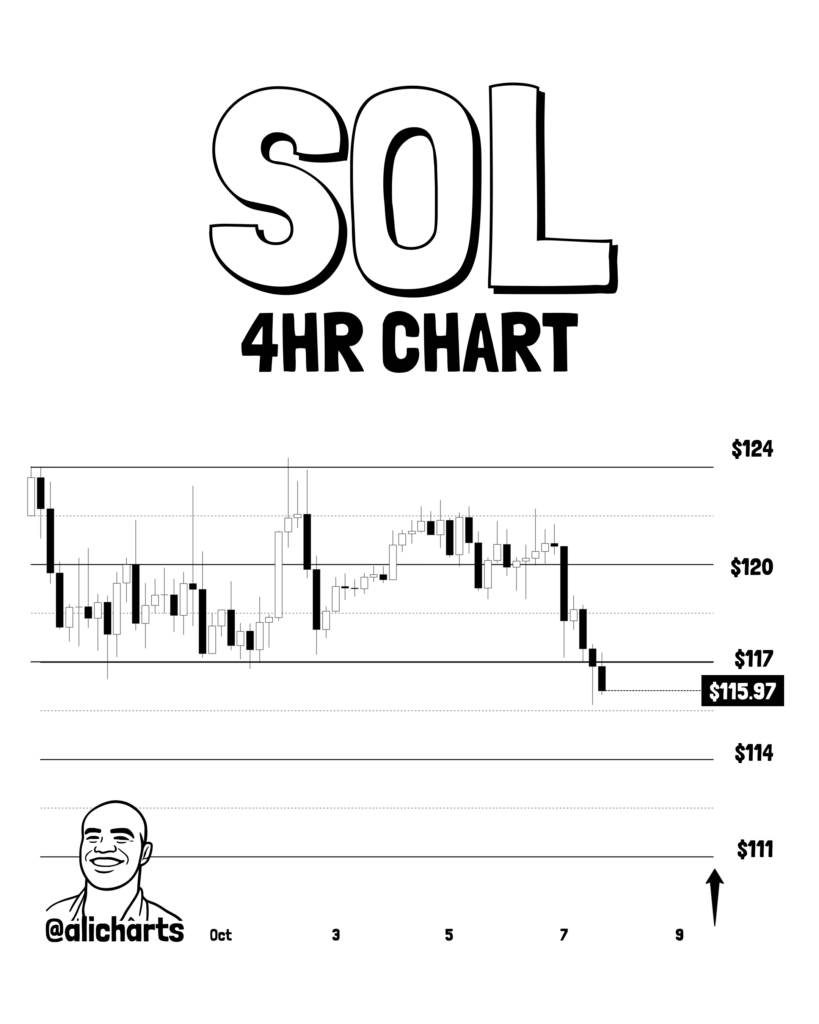
Solana is the third largest altcoin that Ali Charts focuses on. According to its analysis, SOL is breaking channel support downward on the four-hour chart.
The chart shows that the current price of SOL is approximately US$115.97, and the key support level is set at US$117. Analysts stressed that if the four-hour close is confirmed below $117, the break signal will be confirmed.
In this case, the first target is US$114; if US$114 cannot be held, the next target will point to US$111. Above the chart,$120 and $124 constitute resistance. However, Ali Charts 'current assessment focuses on determining whether the $117 support level can be regained.
Although the key points pointed out by analysts for LINK, ADA and SOL are different, the prices of all three are in important areas. In the short term, we need to focus on LINK's US$13.56, ADA's lower rising channel and SOL's US$117 support.
In particular, if SOL closes below US$117 in four hours, LINK continues to stay below US$13.56, and the ADA channel resistance effect continues, market selling pressure may further intensify.
This content is based on general market data and does not constitute investment advice. Readers are advised to conduct independent research.