Exchange Ranking
 Top Exchanges
 24h Volume Ranking
 Popularity Ranking
 Exchange BTC Balance
 Proof of Reserves
 Decentralized Exchanges
 Funding Rate
 Funding Heatmap
 Liquidation Data
 Max Pain
 Long/Short Ratio
 Whale L/S Ratio
 Binance/Okex/Huobi L/S
 Bitfinex Margin L/S
 ETF Tracker
 Solana ETF
 XRP ETF
 Hong Kong ETF
 Bitcoin Treasuries
 Crypto Reversal
 Ethereum Reserves
 HyperLiquid Wallet Analysis
 Hyperliquid Whale Watch
 Large Transactions
 On-chain Movement
 Bitcoin ROI
 Stablecoin Market Cap
 Options Analysis
 News
News Articles
 Economic Calendar
 Features
 Wallet
 Contract Calculator


 Security
 Collections
 Watchlist
 Following
 BTC
BTC After U.S. stocks opened on Wednesday, Bitcoin (BTC) fell below US$78,000 due to higher-than-expected U.S. inflation data.
Highlights:
·The U.S. PCE inflation data in July was 0.1% higher than expectations, and Bitcoin fell further under pressure.
·Markets await Nvidia's second-quarter earnings report, which will be the next potential volatility catalyst on Wednesday.
·Bitcoin price analysis warns that a weekly increase of more than 25% may form a bear market rebound.
Higher-than-expected PCE data put pressure on Bitcoin.
TradingView data showed that Bitcoin's daily price fell by as much as 1%, U.S. stocks also opened lower, and gold fell below $4600 per ounce.
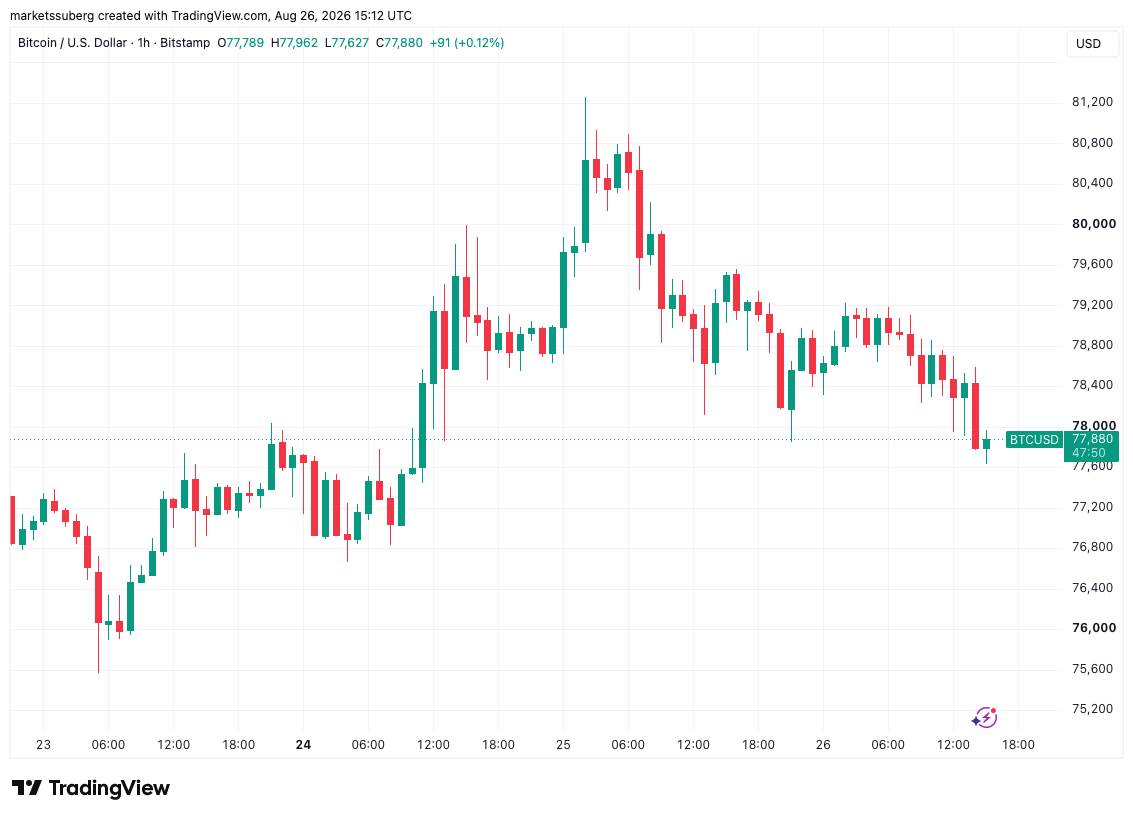 One-hour chart of BTC/USD
The decline stems from the July U.S. personal consumption expenditure (PCE) data-known as the Federal Reserve's "favored" inflation indicator-rising 3.7% year-on-year, higher than the expected 3.6%.
The U.S. Bureau of Economic Analysis (BEA) officially confirmed: "Compared with the previous month, the PCE price index rose 0.2% in July. Excluding food and energy, the PCE price index also rose 0.2%."
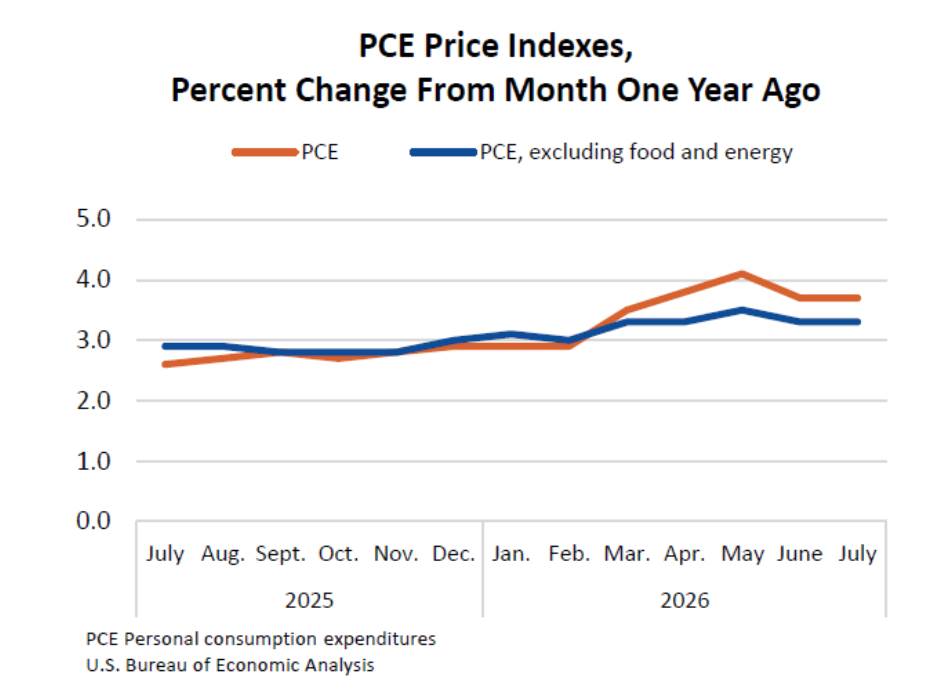 U.S. PCE Index Data (Screenshot)
The market was disappointed with the results after the unexpected decline in PCE in June, which showed the first month-on-month decline in six years.
Trading resource platform The Kobeissi Letter posted on X in response: "U.S. inflation is still almost double the Fed's 2.0% target."
One day after the PCE data is released, the Federal Reserve will hold its annual Jackson Hole Economic Symposium, and Chairman Kevin Walsh is scheduled to deliver a keynote speech on Friday.
Investors are focusing on the second-quarter earnings report released by technology giant Nvidia today, which is expected to trigger fluctuations in short-term risky assets. The company is expected to record quarterly revenue of $92.3 billion, of which CPU revenue--which Raymond James analysts predict--could grow from 3% of Nvidia's total revenue to 5% by 2028, expanding its potential market.
Analysts set key targets for Bitcoin's monthly closing price
Looking at recent price movements, Bitcoin market participants turned their attention to the upcoming August monthly candle close.
Trader and analyst Rekt Capital urged caution, warning that BTC/USD risks continuing the sequence of lower highs since October 2025.
He commented on X, attaching a chart showing the downward resistance trend line: "A monthly close below the blue resistance level will not only consolidate another macro lower high, but will also form converging resistance with the macro downward trend."
BTC/USD monthly chart
Rekt Capital added that unless the cycle of lower highs is broken, Bitcoin's rally over the past week can still be classified as a "rally" in a broader bear market. He focuses on the 50-week exponential moving average (EMA)-at $77,251-as a further trend line that needs to be recovered and held steady in the future. The last time Bitcoin closed monthly above this average was in October 2025.
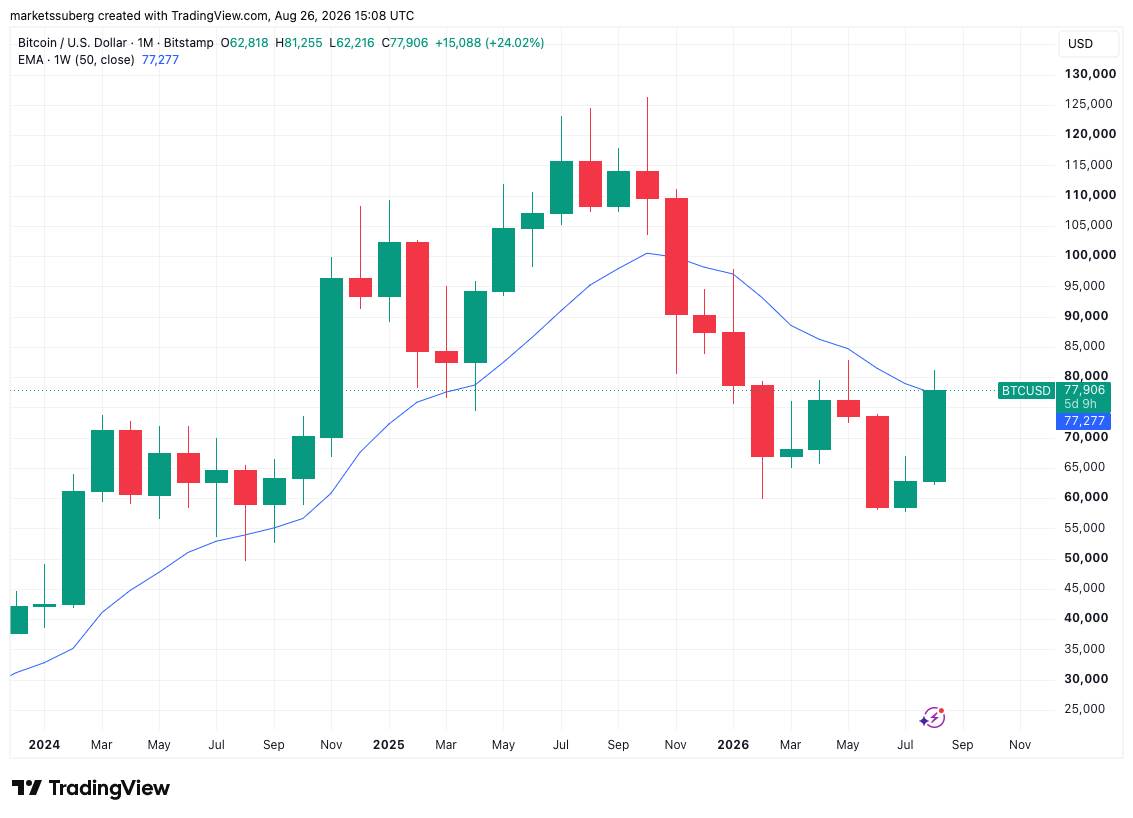 Monthly chart for BTC/USD (including 50-week EMA)