Exchange Ranking
 Top Exchanges
 24h Volume Ranking
 Popularity Ranking
 Exchange BTC Balance
 Proof of Reserves
 Decentralized Exchanges
 Funding Rate
 Funding Heatmap
 Liquidation Data
 Max Pain
 Long/Short Ratio
 Whale L/S Ratio
 Binance/Okex/Huobi L/S
 Bitfinex Margin L/S
 ETF Tracker
 Solana ETF
 XRP ETF
 Hong Kong ETF
 Bitcoin Treasuries
 Crypto Reversal
 Ethereum Reserves
 HyperLiquid Wallet Analysis
 Hyperliquid Whale Watch
 Large Transactions
 On-chain Movement
 Bitcoin ROI
 Stablecoin Market Cap
 Options Analysis
 News
 Articles
 Economic Calendar
 Features
 Wallet
 Contract Calculator


 Security
 Collections
 Watchlist
 Following
 XRP
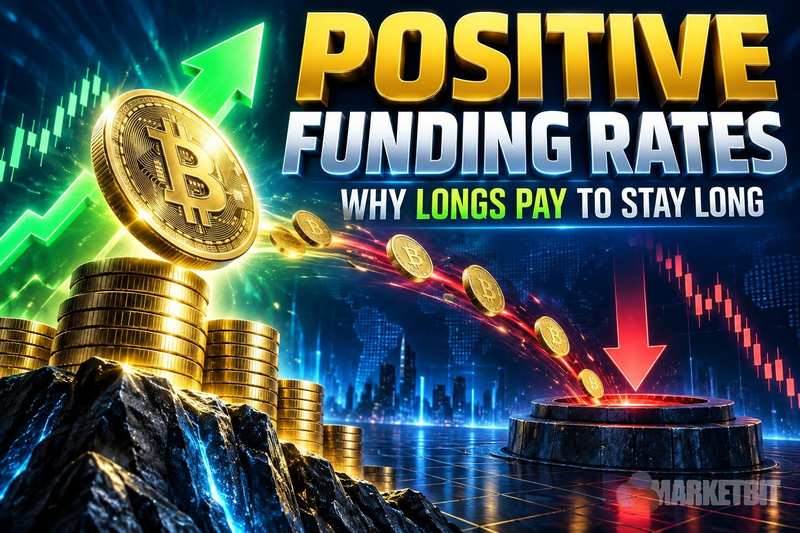
正资金费率意味着什么:并非趋势确认信号
正资金费率表明,在永续合约市场中,杠杆多头持仓者需向空头支付费用以维持仓位敞口。这是一种持有成本机制,与未来现货价格的走势方向没有直接的预测关系。将正资金费率视为趋势确认的交易员,可能会错误地将一个仓位信号解读为方向性信号。
核心要点
- 正资金费率是多头支付给空头的费用,而非上涨趋势的确认。
- 在推断任何趋势之前,必须结合未平仓合约量(Open Interest)的走势和现货价格结构来解读资金费率的走向。
- 在持续的正资金费率环境下,拥挤的多头头寸会放大清算风险,尤其是在现货需求未能跟上衍生品仓位时。
正资金费率的真实含义
永续合约没有到期日,因此交易所通过定期支付资金费用来将合约价格锚定在现货价格附近。当永续合约价格高于现货价格时,费率为正,多头持仓者在每个资金结算间隔(主要平台通常为每8小时一次)向空头持仓者转移一笔费用。
The dollar cost of a long position depends on three variables: the percentage of the funding rate, the size of the nominal principal, and the frequency of the funds settlement. For example, for a position with a nominal principal of $1 million, if the rate is 0.01%, the cost per 8 hours is $100, or $300 per day, and this is the cost before any price changes. This is all about the positive funds rate signal.
The funding rate is a measure of leverage and position, not a measure of spot buying pressure, on-chain accumulation, or actual buying of underlying assets. When traders compare capital rates on different platforms, they need to first standardize the length of the settlement interval before drawing cross-platform conclusions.
Calculation methods and fund settlement interval lengths vary among exchanges. Some platforms use a 1-hour interval, while others use a 4-hour or 8-hour window. The seemingly low annualized rate, if compounded at 3 settlement intervals per day, may cause a significant drag on leveraged positions.
Why positive funding rates do not prove that the market is in an upward trend
Derivatives positions may expand ahead of spot demand. When speculative long interest in perpetual contracts exceeds actual spot purchases, the funding rate turns positive, while spot prices lag or even stagnate. The rate reflects how much derivatives traders are willing to pay to maintain long positions, rather than how much spot market participants are willing to pay to own the underlying asset.
The following three scenarios define the complete interpretation scope of the positive funds rate condition:
未平仓合约量是将资金费率观察转化为结构性视图的关键变量。未平仓合约量与正资金费率同时上升,证实了新资金正在进入多头敞口。而在同样的正资金费率期间,未平仓合约量持平或下降,意味着现有的多头正在吸收资金成本,而没有新参与者加入,这种压缩状况历史上往往是去杠杆化的前兆。
A single high funding rate data contains far less information than a continuous positive funding rate environment spanning multiple consecutive settlement cycles. A surge may reflect a short-term imbalance surrounding news events; while continuous positive funding rates above the average rate during the week indicate a structural bull bias in the derivatives book. The difference between "single data" and "sustainable environment" is the core basis for judgment in fund analysis.
Crowded long positions directly translate into clearing chain risks. When spot prices fall and target severely overvalued derivatives books, mandatory clearing due to margin calls increases selling pressure, and its size is proportional to the total nominal long exposure marked around the clearing price. The XRP derivatives market has demonstrated this mechanism: a sharp sell-off occurred after a 980% clearing imbalance between long and short positions.
How to use funding rates combined with open interest volume and basis
Reliable trend interpretation requires the coordination of four independent signals, none of which can replace the others. Only one-quarter of the required screen content can be provided based on the direction of the funding rate alone.
The dispersion of funds rates at the exchange level has added a fifth dimension. When Binance, Bybit, OKX, and CME perpetual contracts simultaneously have widespread positive funding rates, this long bias reflects a systematic view of positions. When high funding rates are concentrated on a single platform, they are more likely to reflect local basis arbitrage or the margin structure of a specific platform. Daily derivatives snapshots that track funding rates and open interest volumes across platforms provide the cross-platform perspective needed to distinguish systemic signals from individualized signals.
The futures basis (the premium of a fixed-maturity quarterly contract relative to the spot) provides an independent verification layer for the interpretation of the funding rate for perpetual contracts. A positive perpetual funding rate is accompanied by a positive and stable quarterly basis, indicating that derivative demand is real and consistent across products. A positive perpetual funding rate, accompanied by a quarterly basis or premium, indicates a divergence, which is usually resolved through the normalization of perpetual funding rates rather than an increase in spot prices.
The actual failure conditions for constructive funding rate interpretation include: In the continued positive funding rate environment, open contract volume has dropped by more than 10% from recent highs ; While funding rates remain high, spot trading volume has been below its 30-day average for three consecutive days ; or The basis shifts from water above to flat water on the entire curve . Any of the above conditions deserves re-evaluation; if two or more conditions occur at the same time, it will constitute a structural rejection of the argument that "funding rates are used as confirmation indicators." Liquidation heat maps provide specific price levels at which forced selling will accelerate, thereby setting specific risk boundaries for funding rate analysis.