Exchange Ranking
 Top Exchanges
 24h Volume Ranking
 Popularity Ranking
 Exchange BTC Balance
 Proof of Reserves
 Decentralized Exchanges
 Funding Rate
 Funding Heatmap
 Liquidation Data
 Max Pain
 Long/Short Ratio
 Whale L/S Ratio
 Binance/Okex/Huobi L/S
 Bitfinex Margin L/S
 ETF Tracker
 Solana ETF
 XRP ETF
 Hong Kong ETF
 Bitcoin Treasuries
 Crypto Reversal
 Ethereum Reserves
 HyperLiquid Wallet Analysis
 Hyperliquid Whale Watch
 Large Transactions
 On-chain Movement
 Bitcoin ROI
 Stablecoin Market Cap
 Options Analysis
 News
 Articles
 Economic Calendar
 Features
 Wallet
 Contract Calculator


 Security
 Collections
 Watchlist
 Following
 BTC
 ETH
 SHIB
罕见的看涨信号与价格下跌同日出现:Shiba Inu 预测分析
罕见的看涨头条新闻与价格下跌同时出现的情况并不多见。这种反差正是本次 Shiba Inu(SHIB)价格预测的起点。U.Today 报道了该代币的一个显著里程碑,然而在过去 24 小时内,市场已将其价格推低 2.2%。
Shiba Inu 于 2020 年 8 月作为以太坊上的狗狗主题模因代币(Meme Token)推出。该项目随后推出了其自身的 Layer-2 网络 Shibarium,社区也通过 Shibburn 跟踪代币销毁情况。如今,Shiba Inu 依然是按市值计算最大的模因资产之一。
今日 Shiba Inu 价格为 $0.00000543,较前一日下跌 2.2%。该代币在日内交易区间为 $0.00000535 至 $0.00000557,市值为 32 亿美元。社交媒体将该代币标记为 $SHIB,交易所也以此代码列出。寻求 2026 年 10 月 Shiba Inu 价格展望的读者会发现,当前价格处于该日区间的下半部分。
Shiba Inu (SHIB) 实时市场数据
指标数值 价格$0.00000543 24小时变化-2.2% 24小时区间$0.000005357 至 $0.000005572 市值32 亿美元 市值排名#37 数据来源:CoinGecko 市场数据,截至 2026 年 10 月 8 日。其他追踪网站的数据可能略有差异。
今日 Shiba Inu (SHIB) 新闻
The latest Shiba Inu news comes from U.Today, reporting that SHIB triggered the first Golden Cross in two years. A golden cross is when the short-term moving average crosses the long-term moving average upwards. Traders often view this as a signal of increased momentum. 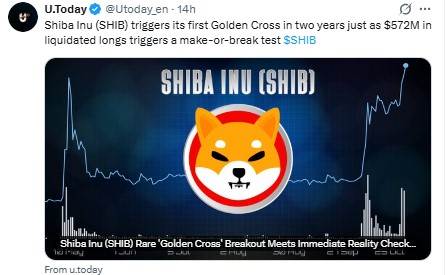
Source: Data from @Utoday_enon X, October 8, 2026.
The same post linked the signal to the $572 million liquidation of long positions and called this moment a critical test of success or failure. Our 4-hour chart does not show a moving average, so we cannot identify the intersection ourselves. Readers should regard this as a reported development and judge it in light of the price levels below.
Other Shiba Inu news, such as the Shibburn destruction report or the Shibarium update, may also change market sentiment, but these are not part of today's report.
Shiba Inu (SHIB) Technical Analysis
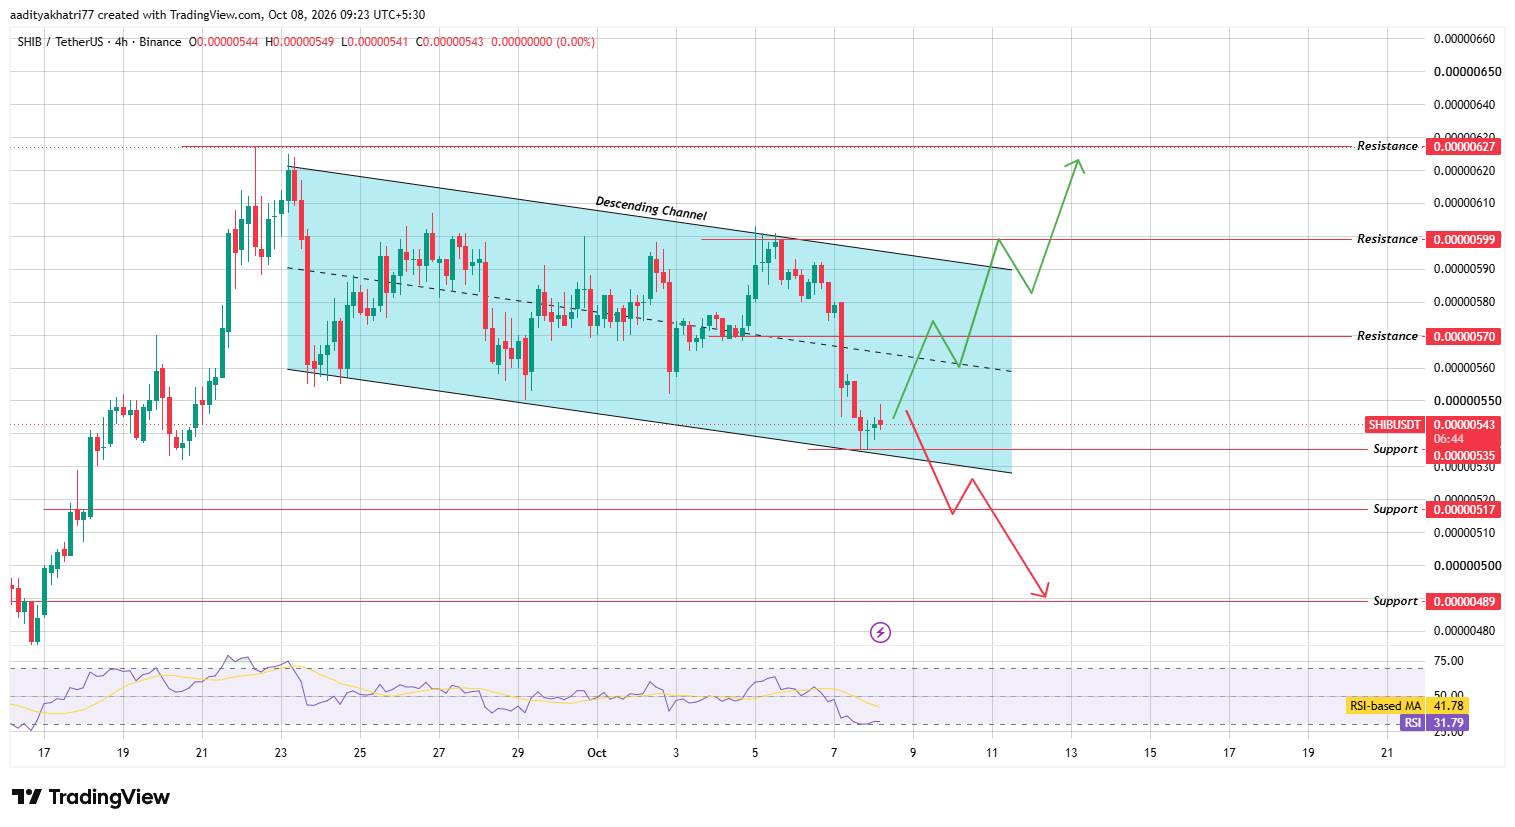 The 4-hour chart shows that SHIB has been operating in a downward channel since approaching a high of 0.0000627 at the end of September. The price is currently near the lower boundary, slightly above the support level of 0.0000535. The current 4-hour candle chart will close at 09:30 Indian Standard Time (IST), so readings may still change.
The Relative Strength Index (RSI) read at 31.79, below its moving average of 41.78. This combination suggests weak momentum and readings close to oversold territory. Oversold readings may signal a rebound, but there is no guarantee that it will happen.
Shiba Inu Price Forecast: Can SHIB rebound from support?
Bullish arguments begin with a rebound from the 0.0000535 support area near the lower boundary of the channel. A rebound will first encounter resistance at 0.00000570, which is about 5.0% higher than the current price and close to the channel mid-line. A close above this level would signal buyers are regaining control.
The next test is near the upper boundary of the channel of 0.0000599, with an increase of about 10.3%. This breakthrough requires confirmation. The 4-hour candle chart should close above the boundary and volume should exceed the average of the top 20 candles. If there is not enough trading volume, the risk of failure to break through the line briefly is high.
If both conditions are met, the chart points to 0.0000627, which is approximately 15.5% higher than the current price. This is where the high was formed at the end of September. Reaching this level will also make the discussion of the "2026 Shiba Inu Price Forecast" more constructive.
What happens to SHIB if the support level breaks?
The bearish argument began when the rally failed and the price fell below 0.00000535. This level is only about 1.5% lower than current prices. A four-hour closing below this level, coupled with increased selling volume, will put the lower boundary of the channel at risk.
A confirmation breakthrough to this boundary will open the path to 0.0000517, with a drop of approximately 4.8%. Below it, the next support level is at 0.0000489, which is about 9.9% lower than today's price.
The weak RSI has increased caution as momentum has not yet reversed. A rebound in the RSI above its moving average of 41.78 will be the first sign of weakening seller power.
Price levels to watch
These Shiba Inu price levels are derived from a 4-hour chart and are judged based on closing prices.
Support resistance 0.00005350.0000570 0.00005170.0000599 0.00004890.0000627 Bull market, Benchmark and bear market scenarios
Scenario setting level Bull market 4-hour closing price above the upper boundary of the channel above average volume 0.0000599 to 0.0000627 Benchmark price fluctuates between support and the midline of the channel 0.0000535 to 0.0000570 Bear market 4-hour closing price below the boundary supported by increased selling pressure 0.00000517 to 0.00000489 SHIB Compared with Bitcoin
SHIB fell 2.2% against the U.S. dollar, but fell only 0.7% against Bitcoin in 24 hours. Simple arithmetic shows that during the same period, Bitcoin fell by about 1.5% against the U.S. dollar. The story of the Ethereum trading pair was similar, falling 0.6%.
In other words, the broader market is also declining, and $SHIB is falling slightly faster than the two major currencies. As a result, Bitcoin's recovery will help any rebound in the chart. A deeper decline in Bitcoin will put pressure on the support level of 0.0000535.
Methodology
本 Shiba Inu 价格预测基于三个输入。价格水平、下降通道和 RSI 来自 TradingView 上 Binance SHIB/USDT 的 4 小时图表,采集时间为 2026 年 10 月 8 日印度标准时间 09:23。市场数据来自同一时间的 CoinGecko 快照。新闻项目来自 U.Today 的报道。
我们仅在 4 小时蜡烛图收盘时接受突破或崩溃,绝不接受蜡烛图内部的运动。成交量也应超过 20 根蜡烛的平均值。本 Shiba Inu 价格预测中的每个目标均设在图表已经测试过的水平。由于没有可用的清算或交易所成交量数据,因此未使用这些数据。
专家观点
关于移动平均线交叉的一般市场评论认为,该信号滞后于价格。黄金交叉确认了一个已经开始的趋势,因此在成交量和收盘价一致时效果最佳。
应用于 SHIB,这种观点倾向于耐心,直到 0.00000599 的通道上边界在收盘蜡烛图上让步。诸如 Shibburn 销毁报告和 Shibarium 活动之类的生态系统项目可能会影响情绪,但它们不能替代价格确认。