Exchange Ranking
 Top Exchanges
 24h Volume Ranking
 Popularity Ranking
 Exchange BTC Balance
 Proof of Reserves
 Decentralized Exchanges
 Funding Rate
 Funding Heatmap
 Liquidation Data
 Max Pain
 Long/Short Ratio
 Whale L/S Ratio
 Binance/Okex/Huobi L/S
 Bitfinex Margin L/S
 ETF Tracker
 Solana ETF
 XRP ETF
 Hong Kong ETF
 Bitcoin Treasuries
 Crypto Reversal
 Ethereum Reserves
 HyperLiquid Wallet Analysis
 Hyperliquid Whale Watch
 Large Transactions
 On-chain Movement
 Bitcoin ROI
 Stablecoin Market Cap
 Options Analysis
 News
News Articles
 Economic Calendar
 Features
 Wallet
 Contract Calculator


 Security
 Collections
 Watchlist
 Following
 BTC
BTC  ZRO
ZRO ZRO rose strongly today: LayerZero broke through several months of decline, and in-depth analysis of price forecasts
ZRO performed vigorously today. LayerZero pulled up strongly, with significant intraday gains, successfully breaking through the downward trend that lasted for several months. This price forecast will analyze whether there is room for further growth in this round of rally or is about to cool down, and clearly determine the key prices for the future outlook. The following is a complete analysis.
Market data was updated at 09:40 Indian Standard Time on August 22, 2026.
Today's Price Forecast for LayerZero: Market Overview
Indicators: Price- $1.0712, 24-hour increase: +25%. Market value: $393.82M, unlocked market value: $753.76M, fully diluted market value: $1.06B, 24-hour trading volume: $100.5M+, trading volume/market value ratio (24-hour): 25.32%, liquidity/market value ratio: 0.15%, total locked position value: $6.96 billion, market value/total locked position value: 0.05684. Total supply: 1 billion ZRO, maximum supply: 1 billion ZRO, circulating supply: 369.14 million + ZRO, number of currency holding addresses: 1 million +.
Data source: CoinMarketCap, as of 09:40 Indian Standard Time on August 22, 2026. Data from other tracking sites may differ slightly.
Could ZRO be the next Bitcoin?
Bitcoin is currently trading at $78,696.09, up 5.03% today, reaching a market value of trillions of dollars and a fixed supply of 21 million dollars that has been in operation for more than a decade. ZRO is a project with a market value of $393.82M and is still building application scenarios for its cross-chain infrastructure, with a maximum supply of 1 billion tokens. Bitcoin's size and historical record place it in a completely different category, and ZRO's story is to prove its unique value in the blockchain messaging arena, rather than competing with Bitcoin's value store role.
Why did ZRO rise today?
ZRO's rise today is in line with a broader rally in alternative currencies, as risk appetite recovers and funds are flowing out of Bitcoin and pouring into alternative currencies. When alternative currencies rise like this, tokens such as ZRO tend to experience larger fluctuations than Bitcoin, which has a smoother rise. No specific positive news related to LayerZero has been confirmed, so this looks more like part of the overall market than a single catalyst.
ZRO Price Forecast Chart: Technical Analysis
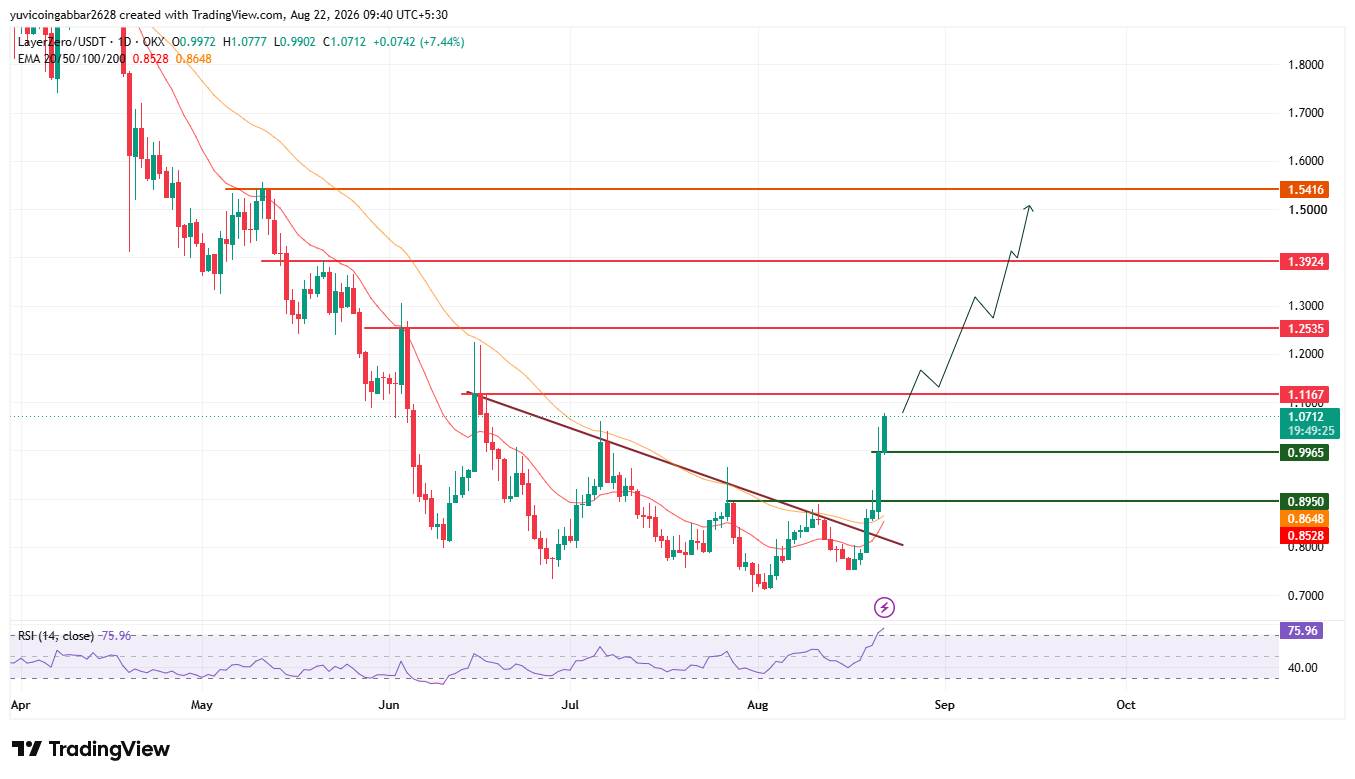
Trading Pair: ZRO/USDT ·Market: Spot (cryptocurrency)·Exchange: OKX ·Timeframe: Daily·Data source: TradingView ·Timestamp: August 22, 2026 09:40 UTC+5:30
ZRO is currently trading at $1.0712, breaking through the downtrend line that has suppressed prices since early June. This breakthrough candle chart cleared the long-term consolidation range between $0.700 and $0.8950, and prices are now approaching the area below the $1.1167 resistance level. The RSI indicator is at 75.96 and has entered the overbought territory, indicating that this round of gains has been over-extended. Even if the overall trend remains bullish, it is normal for a short-term cooling or correction. The EMA moving average group is well below current prices and serves as a long-term support bottom rather than short-term resistance.
Key Prices
Resistance 4:$1.5416, Resistance 3:$1.3924, Resistance 2:$1.2535, Recent Resistance 1:$1.1167, Current Reference Price: $1.0712, First Support: $0.9965, Deep Support: $0.8950, Structural Bottom (EMA Area):$0.8648-$0.8528
LayerZero forecast: bullish scenario vs bearish scenario
bullish scenario: If the price stays above $0.9965, the validity of the trend line break remains. Confirming that the closing price broke past the recent resistance level of $1.1167 will open up room for subsequent gains to $1.2535 or even $1.3924.
Bear scenario: A loss of $0.9965 indicates that the breakthrough momentum is fading, and this round of gains may be just a short-term squeeze on the market. If it falls further below $0.8950, the EMA region ($0.8528-$0.8648) will become support again.
$ZRO price forecast scenario analysis
Scenario 1: Trend line recedes. Trigger condition: Price remains above $0.9965. Possible outcome: Continue to rise to $1.1167. Expiration condition: Closing price fell below $0.9965.
Scenario 2: Channel consolidation. Trigger condition: Price consolidates between $0.700 and $0.8950. Possible outcome: Maintain range volatility before the next wave of market prices. Failure conditions: upper and lower edges of the breakthrough interval.
Scenario 3: The channel breaks below. Trigger condition: Closing price fell below $0.8950. Possible results: Retest the EMA area ($0.8528-$0.8648). Failure condition: Recovering $0.9965.
Can ZRO reach $1.5416?
$1.5416 is the highest resistance level marked on the chart. To reach this level, ZRO needs to break through $1.1167 first, then $1.2535 and $1.3924 in turn. This is a multi-stage process rather than a single continuous rise, especially since the RSI indicator is currently overbought.
LayerZero Price Forecast: Expert Opinion
Analysts point out that trend-line breakthroughs are accompanied by strong trading volume and wide daily ranges, and this trend usually reflects real buying power rather than weak short squeeze. Still, the RSI indicator at 75.96 is a warning sign that such overstretched movements tend to cool down before continuing to rise. In the next few trading days, we need to focus on the $0.9965 to $1.1167 area. Holding the zone will maintain the bullish argument for breakout, while a rapid pullback suggests that buyers have over-chased the gains.