Exchange Ranking
 Top Exchanges
 24h Volume Ranking
 Popularity Ranking
 Exchange BTC Balance
 Proof of Reserves
 Decentralized Exchanges
 Funding Rate
 Funding Heatmap
 Liquidation Data
 Max Pain
 Long/Short Ratio
 Whale L/S Ratio
 Binance/Okex/Huobi L/S
 Bitfinex Margin L/S
 ETF Tracker
 Solana ETF
 XRP ETF
 Hong Kong ETF
 Bitcoin Treasuries
 Crypto Reversal
 Ethereum Reserves
 HyperLiquid Wallet Analysis
 Hyperliquid Whale Watch
 Large Transactions
 On-chain Movement
 Bitcoin ROI
 Stablecoin Market Cap
 Options Analysis
 News
News Articles
 Economic Calendar
 Features
 Wallet
 Contract Calculator


 Security
 Collections
 Watchlist
 Following
 BTC
BTC Core Points
After Bitcoin exceeded US$70,000, the Vector indicator turned.
The previous "risk-haven" phase followed this high.
There is a delay in the release of Vector readings.
Glassnode's broader market compass remains in a "safe haven" state.
US$83,000 is still the next major test level for Bitcoin.
Shifts in market mechanisms are not accurate top predictions.
Glassnode points out: Bitcoin Vector has returned to risk appetite mode
Glassnode said that as Bitcoin prices rebound above US$70,000, its Bitcoin Vector indicator has re-entered "Risk-On" mode. According to public data, its Vector page marks the turning point of the previous "Risk-Off" as October 12, 2025, when Bitcoin began to fall from the $126,000 region.
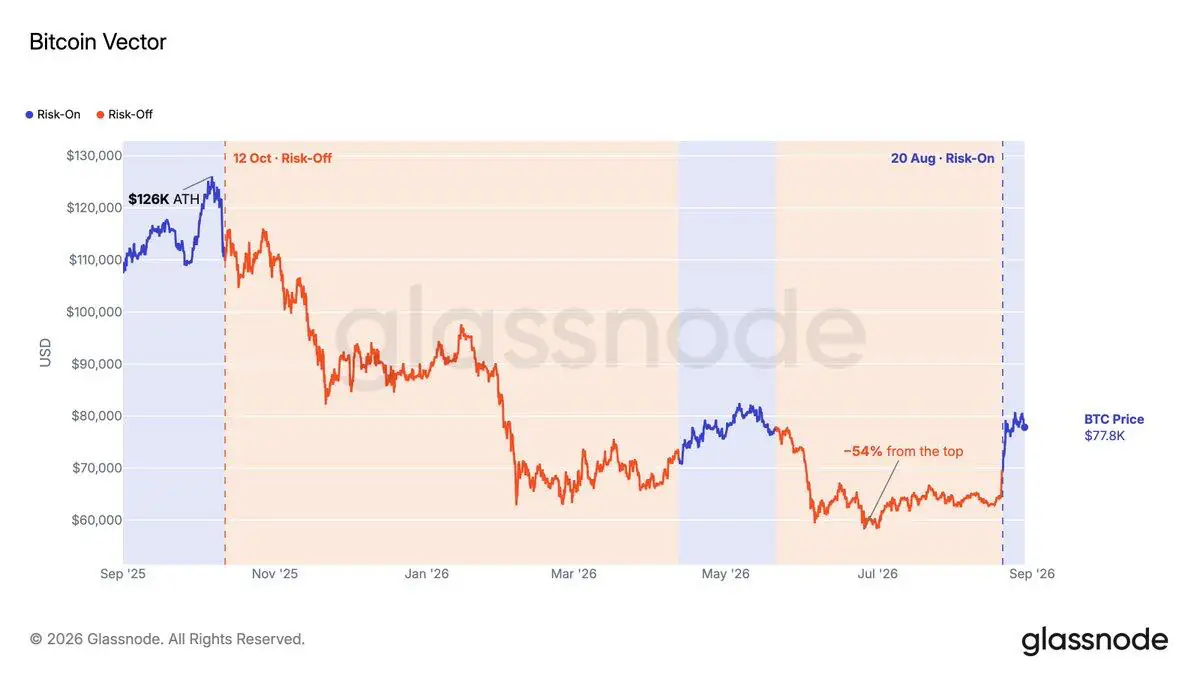
This historical data does not mean that the Vector model accurately identified the market top in advance. The model aims to identify changes in market mechanisms. Glassnode said it combines momentum thresholds and capital flow indicators, and recent readings will be released after a delay. Because the underlying formula is a proprietary algorithm, external readers cannot independently reproduce or fully backtest its signals. A more valuable question is whether the conditions behind the new readings are confirmed by demand data and broader market data.
Why new Vector readings are critical
The latest turning point for Vector's "risk appetite" listed by Glassnode was August 21. The shift came after Bitcoin topped $70,000, a level that is significant because it put many recent buyers back above average entry costs. This reduces investors 'incentive to sell assets simply to preserve capital.
But this did not eliminate the pressure of profit-taking. Bitcoin still needs new buyers to absorb coins tossed by holders who accumulate chips at lower prices. This is the demand issue behind our previous focus on the spot market testing of old bitcoin supply, and it is also the core of the current recovery.
How to interpret Bitcoin Vector
What this shift means
Glassnode's proprietary Bitcoin framework believes that current market conditions are sufficient to support the market moving out of defensive mechanisms.
This shift means nothing
It does not guarantee a straight rise, cannot identify the exact market top, nor does it prevent Bitcoin from testing back support levels.
Glassnode's broader market view remains cautious
When looking at Glassnode's broader Market Compass, the score is 14/100 and is in a "risk averse" state. Unlike Vector, Compass combines seven dimensions, including sector performance, Bitcoin's relationship to macro markets, the cost base of short-term holders, and global liquidity.
These two dashboards answer different questions. Vector evaluates Bitcoin's own market mechanisms, while Compass measures whether the broader crypto market and macro environment are supportive. Taken together, the two paint a picture of Bitcoin's recovery improving but yet not yet sending a comprehensive signal of market safety. Glassnode's Market Compass is a daily real-time reading that may change after release.
Bitwise believes the structure has been fixed, but the breakthrough has not yet been completed
Bitwise Europe's September Bitcoin report has a positive tone, but it sets a higher threshold for confirmation. André Dragosch, head of European research at Bitwise, wrote that as long as Bitcoin holds on to the price levels it has recovered, the new bull market is likely to remain intact.
Bitwise points out that the short-term holder cost base is at approximately US$70,200, the True Market Mean is at approximately US$76,200, and the 200-day moving average is at approximately US$69,100, which are important recovery areas. It also pointed to $83,000 as the last major obstacle: once effectively breached, higher highs will be established and confirmed that the previous pattern of low elevations has been reversed.
Evidence of recovery
Bitcoin trading prices are above the recent holder cost basis, the real market average and its 200-day moving average.
Uncompleted tests
Bitcoin still needs to clear the US$83,000 resistance level through continued spot demand, rather than a market driven mainly by leveraged futures trading.
ETF fund flows provide broader needs testing
Vector's shift requires evidence that buyers, not just short covering, are supporting Bitcoin's recovery.
Data from Farside Investors shows that during the 10 full trading days from August 20 to September 2, the U.S. spot Bitcoin ETF attracted a net inflow of approximately US$1.92 billion.
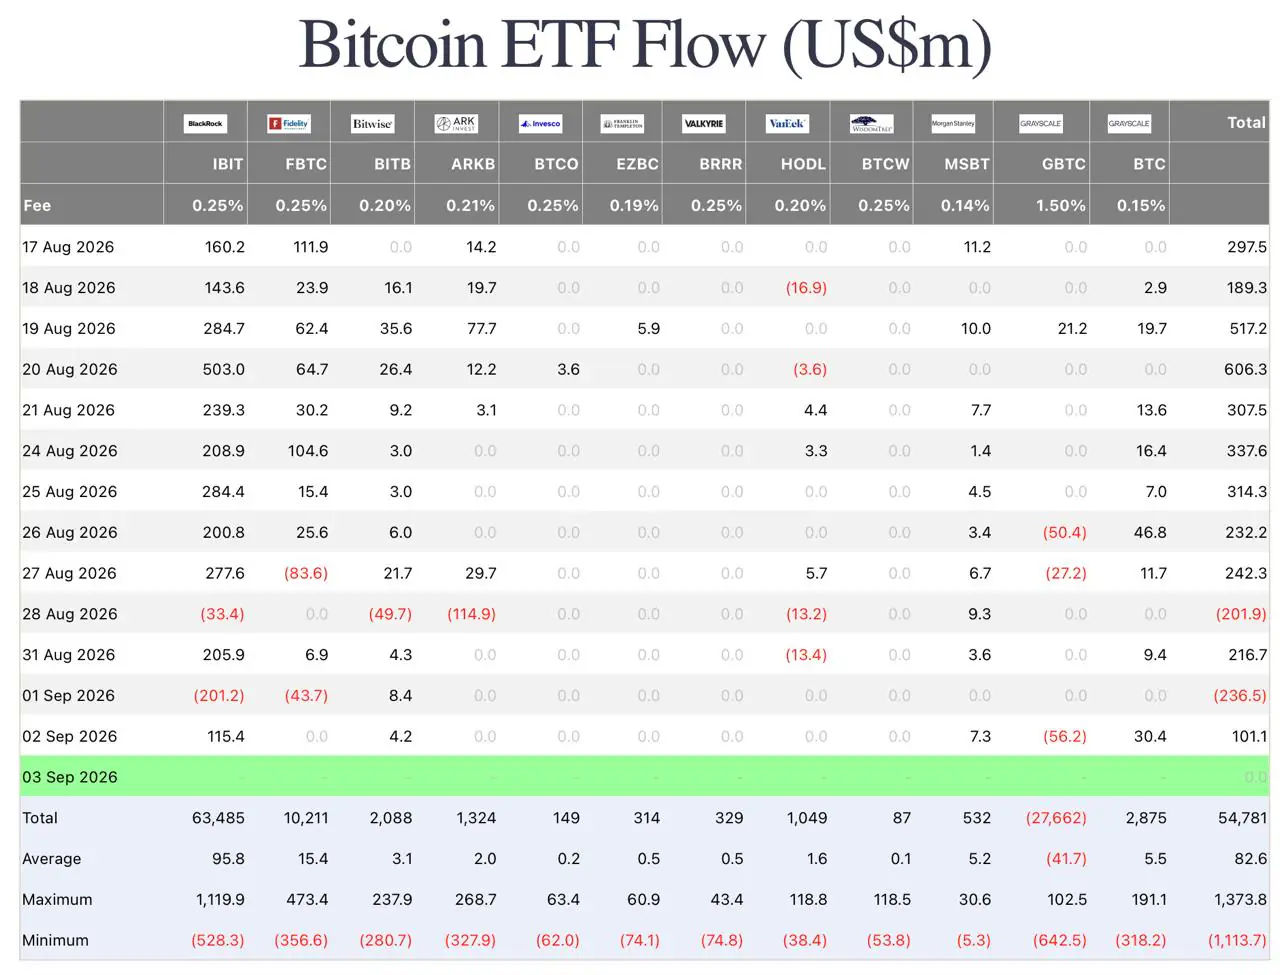
Eight of these 10 trading days were positive inflows. This included a net inflow of more than $600 million on August 20, but the period was interrupted by two outflow days: an outflow of $201.9 million on August 28 and an outflow of $236.5 million on September 1.
This model is more meaningful than a single-day green market. It suggests that demand for new ETFs is returning during the Bitcoin recovery, although buyers have not yet shown the ability to absorb every correction. The next test point is whether capital inflows remain positive as BTC approaches the $83,000 resistance zone.
The actual test is now clear
Bitcoin's new Vector reading describes a market that has regained important lost ground. For this recovery to turn into stronger bullish reasons, three conditions need to be met: Bitcoin should remain above the real market average of $76,200;ETF demand should remain positive for multiple trading days; and prices should not experience excessive leverage accumulation as they clear the $83,000 resistance level.
If Bitcoin loses these conditions, the model will still capture significant improvements since the period of "risk aversion". But this does not solve the larger question: whether Bitcoin's recovery can develop into a lasting new upward trend.