Exchange Ranking
 Top Exchanges
 24h Volume Ranking
 Popularity Ranking
 Exchange BTC Balance
 Proof of Reserves
 Decentralized Exchanges
 Funding Rate
 Funding Heatmap
 Liquidation Data
 Max Pain
 Long/Short Ratio
 Whale L/S Ratio
 Binance/Okex/Huobi L/S
 Bitfinex Margin L/S
 ETF Tracker
 Solana ETF
 XRP ETF
 Hong Kong ETF
 Bitcoin Treasuries
 Crypto Reversal
 Ethereum Reserves
 HyperLiquid Wallet Analysis
 Hyperliquid Whale Watch
 Large Transactions
 On-chain Movement
 Bitcoin ROI
 Stablecoin Market Cap
 Options Analysis
 News
News Articles
 Economic Calendar
 Features
 Wallet
 Contract Calculator


 Security
 Collections
 Watchlist
 Following
 BTC
BTC Senior trader Peter Brandt said what he had previously believed to be a bearish technical pattern had reversed, prompting him to buy Bitcoin, reversing the caution he had earlier this month.
On August 20, Brandt said on X that Bitcoin has been forming a head-and-shoulder pattern, a chart pattern that traders often view as a potential bottom. 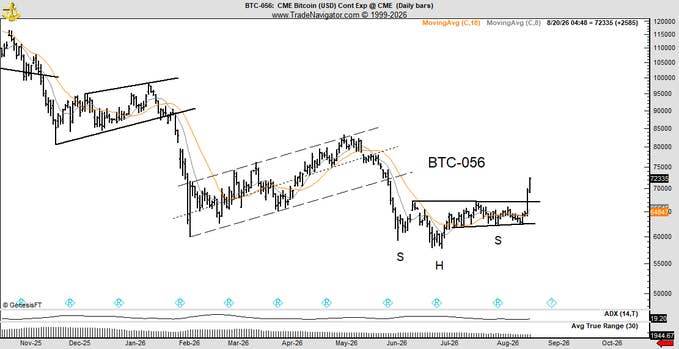
Peter Brandt's chart posted on X
Simply put, the pattern on his chart shows that Bitcoin has formed three major lows, with the middle low lower than the sides. Breaking through horizontal resistance levels known as the "neckline" can mean sellers lose control.
"The completion of the head, shoulder and bottom shape changed this view. I bought breakthroughs, no matter what the outcome was." Brant wrote.
Brandt said that there is a "60% probability" of a downward breakthrough for previously incomplete patterns because Bitcoin is still in a downward trend and its right shoulder has taken an extremely long time to form.
The transaction marks a sharp change from his stance on August 9, when his chart showed Bitcoin could fall to about $58,000.
Brandt has been trading bulk commodities for more than 50 years and is known for accurately predicting major turning points in the market. In 1980, after gold soared to a historical high of nearly $850 an ounce, he turned bearish, and then gold experienced a long plunge, eventually losing more than half of its peak.
Later, he made the same famous prediction about Bitcoin. In January 2018, when Bitcoin was still hovering above $10,000 after a surge in 2017, Brant predicted that the cryptocurrency might fall below $4,000. By December of the same year, Bitcoin had fallen to about $3,200, confirming his bearish judgment.
Brant's purchase came as Bitcoin significantly reversed months of weakness this week.
The rally accelerated as the U.S. Treasury Department said on August 19 that it would double the size of at least some long-term treasury bonds, and President Donald Trump reiterated support for cryptocurrency legislation during a meeting with industry executives at the White House.
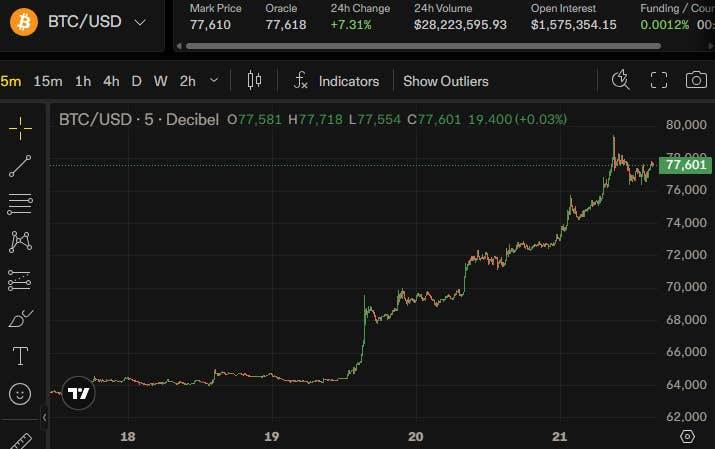
Bitcoin rose more than 20% this week, setting its strongest weekly performance in more than three years.
This trend has also triggered a large-scale short squeeze. According to CoinGlass data, the amount of cryptocurrency clearing in the past 24 hours reached approximately US$1.49 billion, of which approximately US$1.19 billion was short positions, which means that traders betting on continued price declines were forced to close their positions due to rising prices.
Bitcoin accounts for approximately US$735 million in 24-hour clearing.
As of press time, the trading price of Bitcoin was approximately US$77,610, up 7% in 24 hours.
The cryptocurrency is still below the all-time high of more than $126,000 set on October 6, 2025, but the latest breakthrough has brought it back to levels before the summer sell-off.