Exchange Ranking
 Top Exchanges
 24h Volume Ranking
 Popularity Ranking
 Exchange BTC Balance
 Proof of Reserves
 Decentralized Exchanges
 Funding Rate
 Funding Heatmap
 Liquidation Data
 Max Pain
 Long/Short Ratio
 Whale L/S Ratio
 Binance/Okex/Huobi L/S
 Bitfinex Margin L/S
 ETF Tracker
 Solana ETF
 XRP ETF
 Hong Kong ETF
 Bitcoin Treasuries
 Crypto Reversal
 Ethereum Reserves
 HyperLiquid Wallet Analysis
 Hyperliquid Whale Watch
 Large Transactions
 On-chain Movement
 Bitcoin ROI
 Stablecoin Market Cap
 Options Analysis
 News
News Articles
 Economic Calendar
 Features
 Wallet
 Contract Calculator


 Security
 Collections
 Watchlist
 Following
 ETH
ETH Core Points
Robinhood Chain ranks first in DefiLlama's revenue ranking. The chain's revenue mainly comes from Gas fees (transaction fees). Transaction applications generate huge user fees. It should be noted that application revenue and on-chain revenue are calculated separately. It is currently difficult to isolate specific demand data for "stock tokens" separately.
Revenue leads, not Robinhood's earnings performance
DefiLlama's data are 24-hour readings that are rolling in real time and may change after release. As of writing, DefiLlama's real-time revenue ranking shows Robinhood Chain tops the list with $4.01 million in chain revenue in 24 hours, ahead of Canton ($1.69 million) and Tron (approximately $874,000).
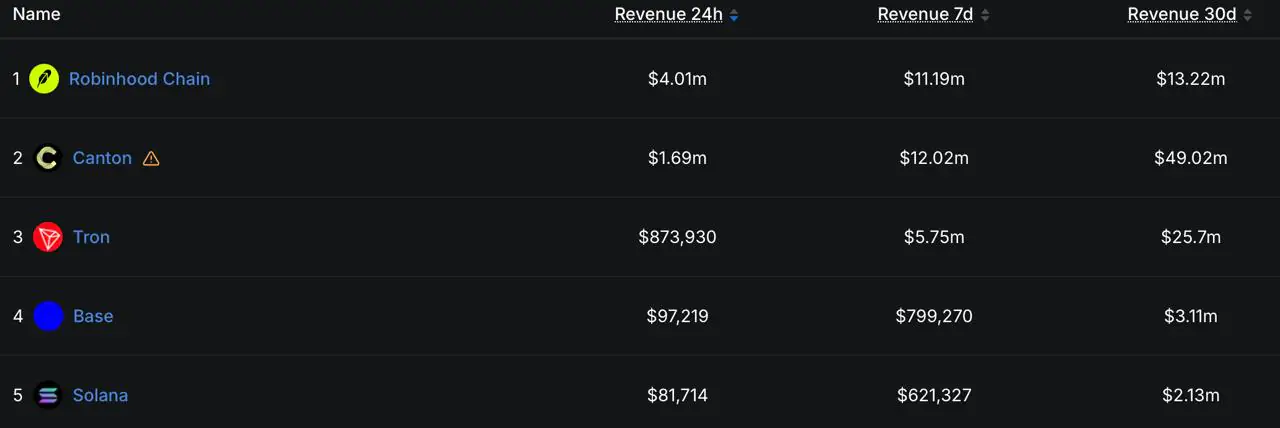
This result needs to be understood in conjunction with the background. DefiLlama's "on-chain revenue" indicator is not equivalent to Robinhood Markets 'corporate revenue. It measures the portion of revenue retained by the network after deducting Ethereum execution and data costs, and allocating shares through the Arbitrum expansion plan.
Robinhood's public main network is an Ethereum-compatible Layer 2 network built based on Arbitrum technology. It is designed to support tokenized assets and open DeFi activities, but the revenue dashboard reflects what people pay to use the network, rather than which Robinhood product creates each transaction.
Most of the chain revenue comes from Gas fees
Users are required to pay ETH when sending transactions or interacting with apps on Robinhood Chain. These payments are used to cover the cost of Layer 2 execution and the cost of publishing data back to Ethereum. During the same 24-hour period, the network recorded a total transaction fee of $4.45 million-the total amount of ETH paid by users for Robinhood Chain Gas.
It is because of this difference that fees and revenue should not be considered interchangeable concepts. Fees show how much users spend; revenue estimates are how much money the network retains after deducting specified costs and revenue sharing.
- $4.45 million online fee: The total amount of ETH paid by users when conducting transactions on the Internet.
- $4.01 million in on-chain revenue: After deducting the listed costs and revenue sharing, DefiLlama attributed the amount of net revenue to the network.
- $4.32 million application revenue: Revenue retained by on-chain applications, measured independently of network revenue.
According to DefiLlama's methodology, the Arbitrum extension program receives 10% of Robinhood Chain's net income, 80% of which goes to the Arbitrum DAO treasury and 20% to developer funds.
Transactions and new coin issuance are incurring the largest fees
Application-level breakdown shows the main flow of user funds. DefiLlama's expense dashboard shows that Uniswap is the largest source of user-paid app fees, at approximately $8.92 million. This is the total amount of exchange fees paid by traders and not the $8.92 million in revenue retained by Uniswap.
Pons and GMGN also performed well. Pons charges new coin issuance and conversion fees, while GMGN charges users who transact through robots. Collectively, these data points to crypto-native activity-including redemption, token issuance, and automated transactions-as the main source of spending on the chain that day.
Application data is attributed to the respective protocols. They should not be added to Robinhood Chain's $4.01 million net chain revenue because they measure data at different levels of the ecosystem.
The dashboard does not isolate the need for "stock tokens"
Robinhood built the network to support tokenized stocks, exchange-traded funds (ETFs) and other real-world assets (RWAs). During its real-time dashboard check, it showed an active RWA market value of approximately US$196 million, DEX trading volume of US$1.4 billion, and perpetual contract trading volume of US$304.6 million.
These readings show significant activity volumes, but do not reveal how much of the day's Gas fees or app fees came from "stock tokens." Therefore, existing data cannot support the statement that "tokenization of stocks led to a surge in revenue." It does suggest that the large amount of paid usage currently surrounding the chain is generated by the transaction infrastructure.
Why Arbitrum connectivity matters
Robinhood Chain's revenue is not only related to its own network, but also a portion of it flows back into the Arbitrum ecosystem. This relationship is part of the design of the network. By contrast, Arbitrum Nova's shift to a reduced support pattern is particularly clear: Robinhood Chain is generating paid activity, while Nova's user and DeFi activity has declined before support patterns are reduced.
What proves that this surge is permanent?
A 24-hour lead in a single day does not establish a sustainable business model. The next signal will be: As issuance and trading activity cools, while DEX trading volume, stablecoin balances and RWA activity continue to rise together, whether chain revenue can remain high.
Readers can focus on real-time revenue rankings, expense segments and Robinhood Chain metrics. The continued combination of network fees and real-world asset activity would be stronger evidence than a day of activity dominated only by crypto-native transactions.