Exchange Ranking
 Top Exchanges
 24h Volume Ranking
 Popularity Ranking
 Exchange BTC Balance
 Proof of Reserves
 Decentralized Exchanges
 Funding Rate
 Funding Heatmap
 Liquidation Data
 Max Pain
 Long/Short Ratio
 Whale L/S Ratio
 Binance/Okex/Huobi L/S
 Bitfinex Margin L/S
 ETF Tracker
 Solana ETF
 XRP ETF
 Hong Kong ETF
 Bitcoin Treasuries
 Crypto Reversal
 Ethereum Reserves
 HyperLiquid Wallet Analysis
 Hyperliquid Whale Watch
 Large Transactions
 On-chain Movement
 Bitcoin ROI
 Stablecoin Market Cap
 Options Analysis
 News
News Articles
 Economic Calendar
 Features
 Wallet
 Contract Calculator


 Security
 Collections
 Watchlist
 Following
 XRP
XRP On August 31, the net inflow of XRP ETF reached US$5.64 million, of which Canary products attracted US$4.71 million in new funds. The cumulative net inflow reached US$1.669 billion, and the total assets of tracked products were approximately US$1.455 billion.
The recent increase in capital inflows contrasts sharply with the weakening of XRP prices, showing a significant divergence between capital demand and underlying price performance. Despite the recent weakness in the spot market, the net inflow of XRP ETF still increased on August 31, and new funds entered listed products.
Single-day net inflow shows concentrated demand
BankXRP reported that Canary's XRP ETF received a net inflow of US$4.71 million on August 31. Bitwise products added US$930,000, bringing the total net inflow for the day to US$5.64 million. Despite uneven participation among funds, the data still shows positive demand.
The chart for the same period shows XRP trading at approximately US$0.72. The XRPC product attracted approximately 3.45 million XRPs during the latest trading session, another XRP product received approximately 650,000 XRPs, while other products performed lackluster.
As a result, Canary accounted for the vast majority of net inflows reported that day, contributing approximately 84% of the total of US$5.64 million. Bitwise provides the rest from two active products.
This concentration reflects the complexity of the latest trading session. Positive net inflows indicate that new funds have entered listed products after redemption. However, the chart shows that overall participation among funds remains limited.
Historical net inflows contrast with weak prices
Long-term charts show that net inflows are stronger in earlier market stages. Several large green histograms appear when XRP is at higher prices, and these stages are also accompanied by significantly larger one-day net inflow readings.
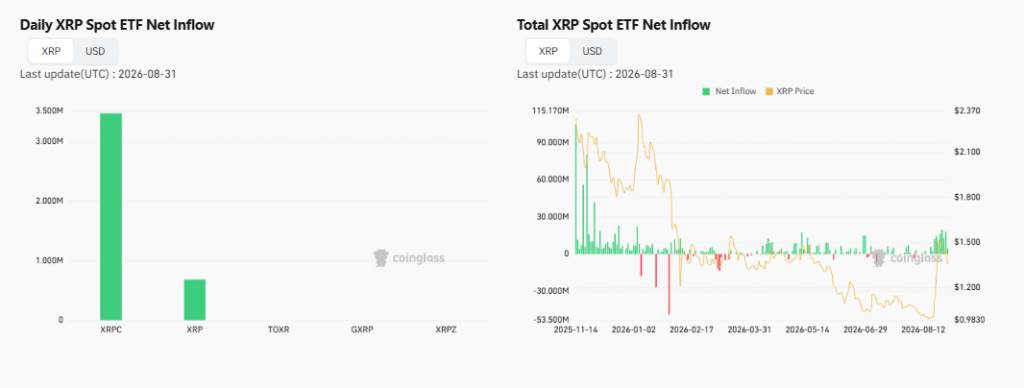
Around February, the capital flow situation changed, with multiple large red histograms appearing. These outflows are in sync with the weakening of the orange price line in the chart, indicating that capital is leaving products during an increasingly difficult period for the market.
At the turn of spring and summer, capital flows become more mixed. Green and red histograms increase in frequency, but lack a consistent directional pattern. At the same time, XRP prices continue to slide towards lower levels.
Recent activity has shown a different pattern from previous months. As XRP approaches depressed prices, green net inflow histograms become more frequent. This led to a significant deviation between ETF demand and underlying market performance.
Cumulative demand reaches new scale
The dashboard shows that the historical cumulative net inflow is approximately US$1.669 billion. The total asset management scale of tracking products is approximately US$1.455 billion. XRP ETF assets account for approximately 1.67% of XRP's total market value.
Cumulative net inflows and current assets measure different aspects of fund activity. Historical net inflows track the total amount of funds that have entered since the product was launched. Current assets may fluctuate due to changes in prices, redemptions, fees and other funds.
The largest product shown holds approximately $507.23 million in net assets. Other funds maintain small balances in the market. This distribution suggests that investors can still gain XRP exposure through a variety of trading products.
Therefore, the latest data continues the established trend of capital flows. Single-day net inflows remained positive, but participation remained concentrated in a few products. If multiple issuers can continue to see net inflows, it will more clearly prove that demand is expanding.