Exchange Ranking
 Top Exchanges
 24h Volume Ranking
 Popularity Ranking
 Exchange BTC Balance
 Proof of Reserves
 Decentralized Exchanges
 Funding Rate
 Funding Heatmap
 Liquidation Data
 Max Pain
 Long/Short Ratio
 Whale L/S Ratio
 Binance/Okex/Huobi L/S
 Bitfinex Margin L/S
 ETF Tracker
 Solana ETF
 XRP ETF
 Hong Kong ETF
 Bitcoin Treasuries
 Crypto Reversal
 Ethereum Reserves
 HyperLiquid Wallet Analysis
 Hyperliquid Whale Watch
 Large Transactions
 On-chain Movement
 Bitcoin ROI
 Stablecoin Market Cap
 Options Analysis
 News
News Articles
 Economic Calendar
 Features
 Wallet
 Contract Calculator


 Security
 Collections
 Watchlist
 Following
 ADA
ADA  BNB
BNB  BTC
BTC  ETH
ETH TLDR: A quick overview of key points
Contents
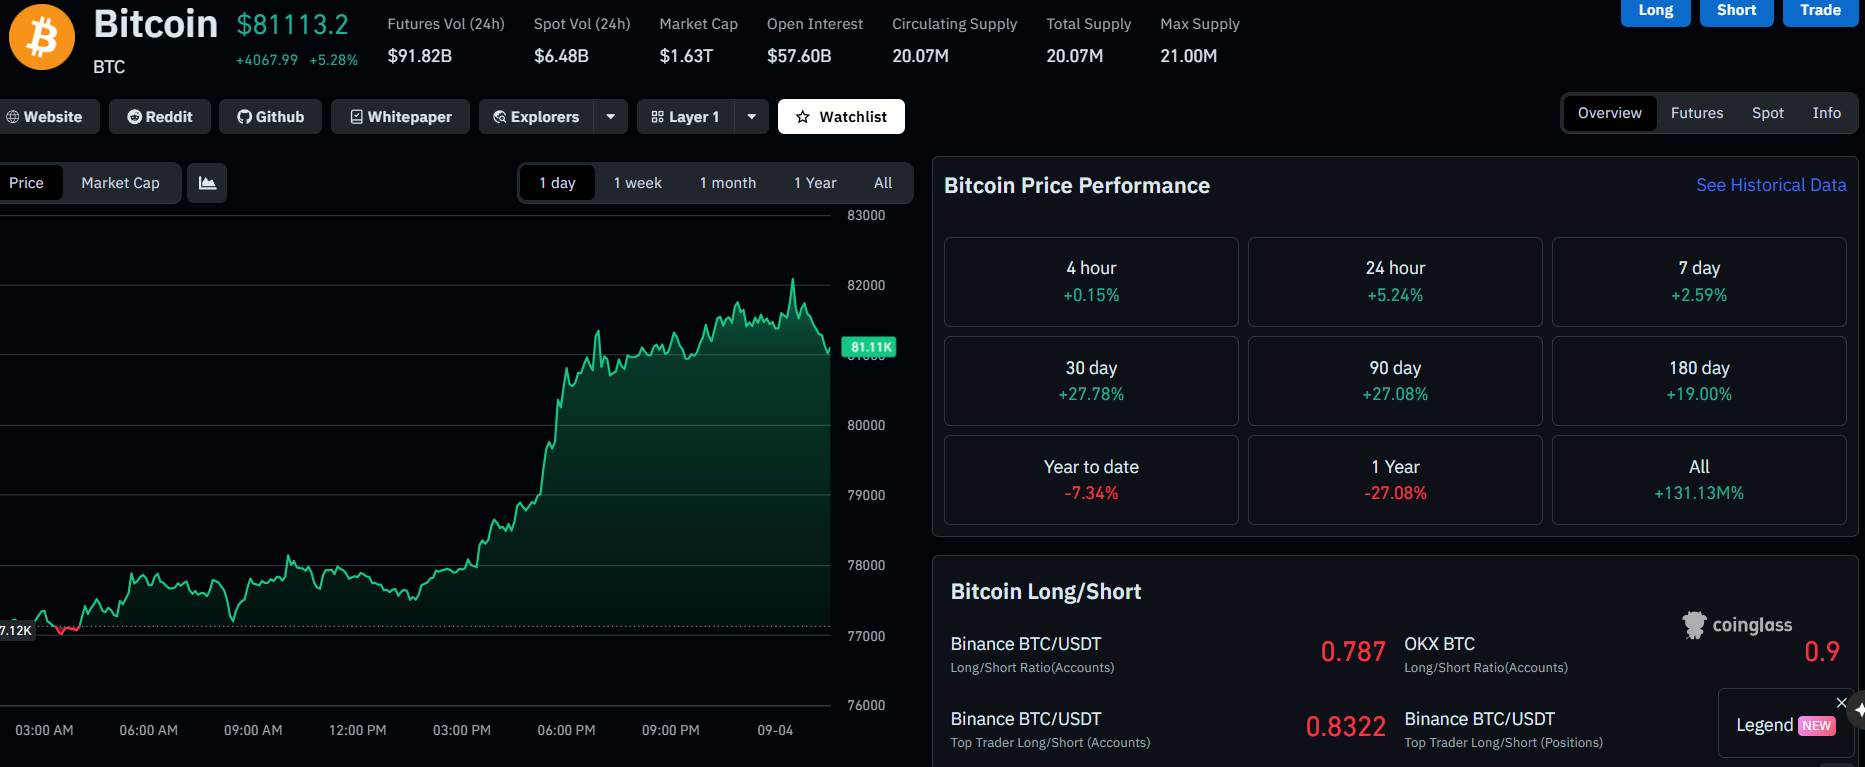
Bitcoin prices have recovered strongly from their 50-week moving average
Derivatives activity has accumulated near the resistance level of US$82,814
Bitcoin prices are trading above the 50-week moving average (approximately US$81,041), making the weekly close the focus of technical trends.
A weekly close above US$82,814 would form the first higher high in the downtrend and challenge the established bearish market structure.
During the upward price period, Bitcoin futures trading volume reached approximately US$84.74 billion, and open interest contracts climbed to approximately US$57.86 billion.
The total amount of BTC open positions was approximately US$229.56 million, of which US$214.81 million were sold by short positions and only US$14.74 million were sold by long positions.
Bitcoin prices strongly recover their 50-week moving average
After experiencing a strong daily-level rise, bitcoin prices have returned to the much-watched 50-week moving average. BTC hit US$81,797, then fell back to around US$81,400, keeping traders focused on the weekly close. This trend puts the $82,000 to $83,000 resistance range within close reach. Analyst Scott Melker sees $82,814 as a key level in the weekly structure.
If the weekly close above this price, it will mark the first time Bitcoin has reached a higher high since the downtrend began. This will also confirm that prices are firmly established above their long-term moving averages. As a result, Bitcoin prices are currently near a technical threshold that is expected to challenge the previously formed series of lower highs and lows. Weekly closing results are crucial.
"Bitcoin native indicators have returned above the 50-week moving average. Can we achieve a solid weekly close this week?"
Market analyst Ted Pillows highlighted the 50-week moving average around $81,041. Bitcoin has spent most of the past year running below this indicator, making it a resistance level on the decline. The latest round of gains has caused BTC to break strongly through the region on the daily chart. This week's weekly close will determine whether the bulls can hold on to this rebound.
A previous breakthrough attempt failed at a similar level. Bitcoin hit $81,265 on August 25, when its 50-week moving average was around $81,085. Shorts blocked the rally at this position before a confirmed weekly breakthrough occurred. The current weekly K-line shows stronger upward momentum, but prices still need to hold on to this level at the close.
Bitcoin is also approaching US$82,814, which Melker believes is a structural trigger. Breaking through this level would create the first higher high in months, ending the previous pattern of falling peaks. This change will negate a core feature of the bearish trend and put BTC above the resistance band near $82,000 to $83,000.
The 50-week moving average has extra weight because it has suppressed Bitcoin many times in past bear markets. Weekly close prices often fail to gain a firm footing above these downtrends until they come to a close. A sustained recovery does not guarantee further gains, but it will change the market structure that technology traders focus on. Subsequent momentum depends on whether the bulls can hold on to their recovered moving averages at the final weekly close.
"Bitcoin Weekly. It's time to pay attention. A close above $82,814 will form the first higher high and officially end the bearish trend and most bearish arguments from a technical perspective. At the same time, it will also confirm that the weekly line closes above the 50-week moving average."
The rise in Bitcoin prices has also driven the entire cryptocurrency market. BTC traded above $81,800 in this round of gains, an increase of nearly 6%. Ethereum, BNB and Cardano also recorded gains in the same market trend. This suggests that during the trading hours of the day, buying power has exceeded Bitcoin itself and extended to a wider range of currencies.
Derivatives activity accumulates near the US$82,814 resistance level
According to CoinGlass data, Bitcoin futures volume in 24 hours was approximately US$84.74 billion. Open interest rose to approximately $57.86 billion, indicating that leveraged positions increased as prices rose. This position layout may intensify short-term movements when forced liquidations accelerate market orders, but may also amplify volatility when prices reverse.
During the same period, the total amount of open positions in Bitcoin positions was approximately US$229.56 million. Among them, short positions accounted for US$214.81 million, while long positions accounted for only US$14.74 million. This imbalance suggests that during the rally, bearish traders absorbed most of the forced closing losses.
Bitcoin prices benefited from this short covering pressure as they broke through the 50-week moving average. Traders who close short positions must buy back the exposure, increasing buying demand during the rise. Still, the rise in open interest means there is still a lot of leverage in the futures market.
The next test will be the US$82,000 to US$83,000 range and the precise US$82,814 resistance level. If the weekly close can stand above these two levels at the same time, it will confirm the formation of a higher high and strengthen the breakthrough signal. Failure to hold the long-term moving average means that the blocked scenario in August is still of reference significance to traders.
Bitcoin prices are currently between confirmed support formed by their recovered moving average and near-term resistance. Market participants will pay close attention to whether spot buying can maintain its gains after the tide of selling positions. Futures position data will also reveal whether new positions follow breakthroughs or whether leverage is beginning to fade. CoinGlass data shows that during the 24-hour statistical period, the amount of short positions opened was more than 14 times that of long positions opened. A weekly close will ultimately reveal whether buyers can turn resistance into support.