Exchange Ranking
 Top Exchanges
 24h Volume Ranking
 Popularity Ranking
 Exchange BTC Balance
 Proof of Reserves
 Decentralized Exchanges
 Funding Rate
 Funding Heatmap
 Liquidation Data
 Max Pain
 Long/Short Ratio
 Whale L/S Ratio
 Binance/Okex/Huobi L/S
 Bitfinex Margin L/S
 ETF Tracker
 Solana ETF
 XRP ETF
 Hong Kong ETF
 Bitcoin Treasuries
 Crypto Reversal
 Ethereum Reserves
 HyperLiquid Wallet Analysis
 Hyperliquid Whale Watch
 Large Transactions
 On-chain Movement
 Bitcoin ROI
 Stablecoin Market Cap
 Options Analysis
 News
News Articles
 Economic Calendar
 Features
 Wallet
 Contract Calculator


 Security
 Collections
 Watchlist
 Following
 DASH
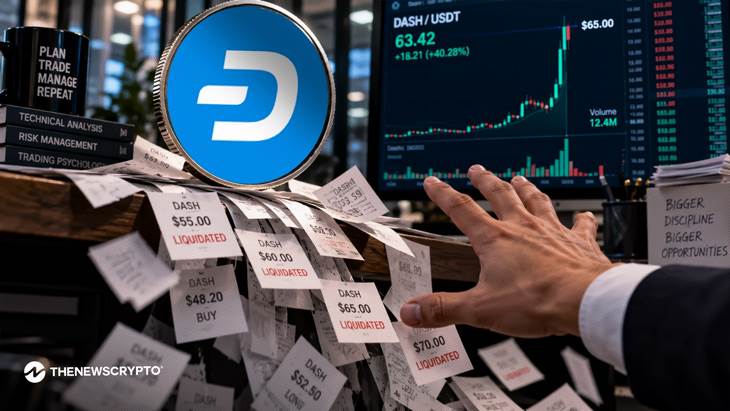
DASH DASH broke through the $70 mark, with strong short-term momentum but facing the risk of overbought
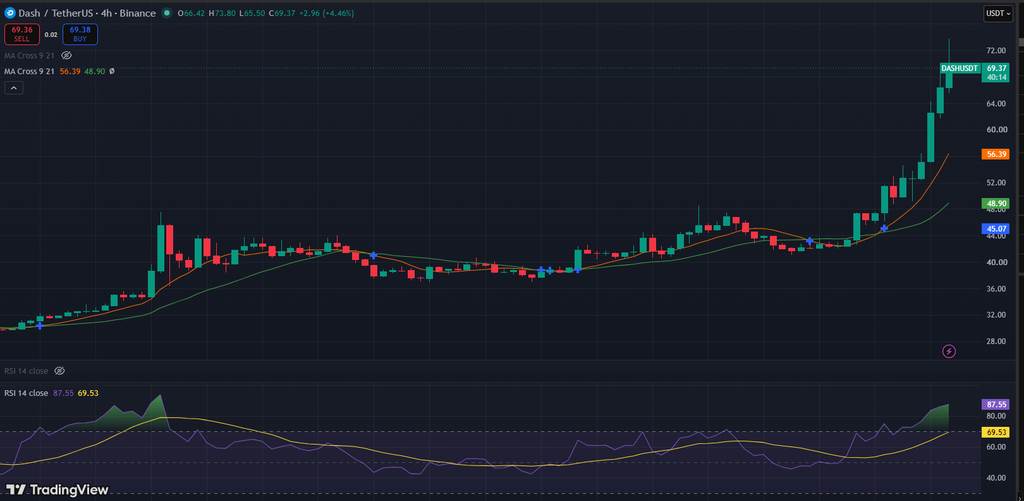
After experiencing a strong four-hour breakthrough, DASH prices climbed above $70, reaching a maximum of approximately $73.80. At the same time, the Relative Strength Index (RSI) rose above 87, showing strong buying momentum, but also means that DASH has officially entered overbought territory.
Today, Dash (DASH), one of the leading privacy coins, saw a significant increase. As overall buying activity in the market increased, the token has increased by more than 47% in the past 24 hours. According to data, DASH is currently trading at close to $70. During the latest 24-hour trading cycle, its price fluctuated between an intraday low of $49.46 and a high of $72.95. The market value of the altcoin has climbed to approximately US$913.8 million, while daily trading volume has reached US$561 million, an increase of more than 193%.
This jump has pushed DASH to heights unseen since January this year, making it one of the strong performers in the current rebound of privacy coins. In addition, Dash recently held the DashCon 2026 event in Amsterdam, and other privacy-focused assets also achieved strong gains, making the entire privacy sector regain market attention.
Technical trend: Strong trend but overheated
The technical pattern shows strong short-term momentum, but also shows that the market is moving faster. On the 4-hour chart, DASH prices climbed all the way from a low of just over $40 to above $70, experiencing a series of strong buying actions. The latest candle chart on the Binance DASH/USDT chart shows that the token was trading at approximately $69.37 after hitting an intraday high of $73.80. Currently, DASH stands firmly above the $64 level, which has become an important support area after the latest breakthrough.
 (Source:TradingView)
Looking further at the chart, you can see a clear bullish structure. The 9-day moving average is around $56.39, while the 21-day moving average is around $48.90. Both are lower than current prices and are trending upward, indicating that buyers have mastered the short-term trend.
DASH first broke through the $45 area, then accelerated above $52, and successfully broke through $60. Each rise is accompanied by a huge green candle line, indicating strong buying pressure rather than a slow recovery.
Despite this, the current kinetic energy appears to be overstretched. The 14-day RSI on the 4-hour chart is around 87.55, well above the 70 level usually associated with overbought conditions. This does not mean that the rally is bound to reverse, but it suggests that prices are moving too fast and may face profit-taking pressure. At the same time, MACD remains positive, with a five-day moving average of around $69.67, indicating that short-term momentum is still in favor of buyers.
If DASH can maintain this trend, the near-term resistance level is around $73.80, the latest chart high and an area that has repeatedly refused to rebound. If this level can be broken cleanly and cleanly, the current breakthrough structure will be maintained. If the breakthrough fails,$64 will be the first important support level, followed by the moving average region of $56-$57.
Currently, the 4-hour trend remains firmly bullish. But extreme RSI indicators suggest a period of consolidation or correction in the market before attempting another upward move.