Exchange Ranking
 Top Exchanges
 24h Volume Ranking
 Popularity Ranking
 Exchange BTC Balance
 Proof of Reserves
 Decentralized Exchanges
 Funding Rate
 Funding Heatmap
 Liquidation Data
 Max Pain
 Long/Short Ratio
 Whale L/S Ratio
 Binance/Okex/Huobi L/S
 Bitfinex Margin L/S
 ETF Tracker
 Solana ETF
 XRP ETF
 Hong Kong ETF
 Bitcoin Treasuries
 Crypto Reversal
 Ethereum Reserves
 HyperLiquid Wallet Analysis
 Hyperliquid Whale Watch
 Large Transactions
 On-chain Movement
 Bitcoin ROI
 Stablecoin Market Cap
 Options Analysis
 News
News Articles
 Economic Calendar
 Features
 Wallet
 Contract Calculator


 Security
 Collections
 Watchlist
 Following
 ZEC
ZEC Zcash is reaching its peak moment: Market Overview and Price Forecast
Grayscale's Zcash ETF attracted approximately US$179 million in inflows in less than two weeks, ranking among the top 1% of nearly 4,000 ETPs (exchange-traded products), with data sources being BSCN. According to Onchain Lens, a single wallet withdrew $41.6 million worth of $ZEC directly from the exchange in six days, and the buying momentum did not stop. Since 2024, the price of $ZEC has increased by nearly 8,000%. Current Zcash price forecasts spark discussion: Is it too late for the crowd chasing this hot spot, or is it the right time?
Market data as of September 12, 2026, based on a timestamp chart and a liquidation snapshot at approximately 10:01 (UTC time).
Zcash price forecast today: Market Overview
Indicator Value Price $1,133.20 Market Value $19.05 billion (+5.68%) Fully diluted valuation (FDV)$23.72 billion 24-hour transaction volume $2.02 billion (+15.06%) transaction volume/market value ratio (24h)10.63% Total supply 16.86 million Maximum supply 21 million Circulation supply 16.86 million Source: CoinMarketCap data, as of September 12, 2026 10:01 IST. Data from other tracking sites may differ slightly.
ZEC Clearing Data: Today's Cryptocurrency News
Total clearing amount in the window period Long clearing short clearing 1 hour $218.22K $189.90K $28.32K 4 hours $1.50M $1.39M $107.16K 12 hours $3.55M $2.71M $836.94K 24 hours $17.65M $5.99M $11.67M During the full 24 hours, as the price of $ZEC rose, the short position suffered greater losses. But in the recent 1-hour, 4-hour and 12-hour windows, things have reversed and bulls have now absorbed most of the losses, indicating that the rally is cooling and entering the current correction phase (data from Coinglass).
Zcash ETF inflows signal bullish prospects
According to BSCN data, Grayscale's Zcash ETF has become the fastest-growing altcoin ETP by net assets, ranking among the top 1% of nearly 4,000 ETPs covering crypto assets, commodities, stocks and fixed income.
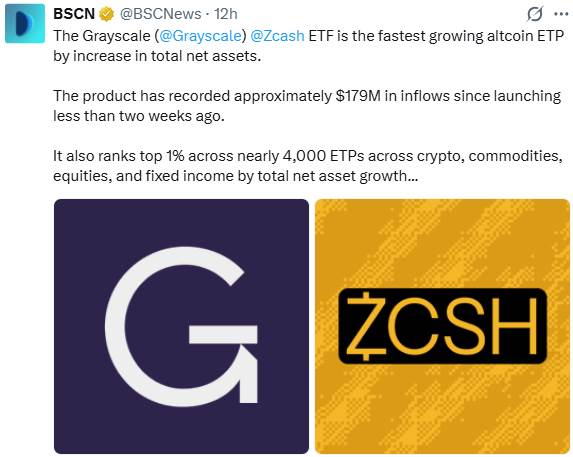 Since its launch, the fund has attracted approximately US$179 million in inflows.
ZEC mining trends boost Zcash cryptocurrency forecasts
Grayscale Research points out that Bitcoin miners earn about US$35 million a day, while Zcash miners earn about US$2 million a day, but they believe that the profitability of Zcash mining per device is still roughly twice that of Bitcoin. Profitability per megawatt hour is about four times.
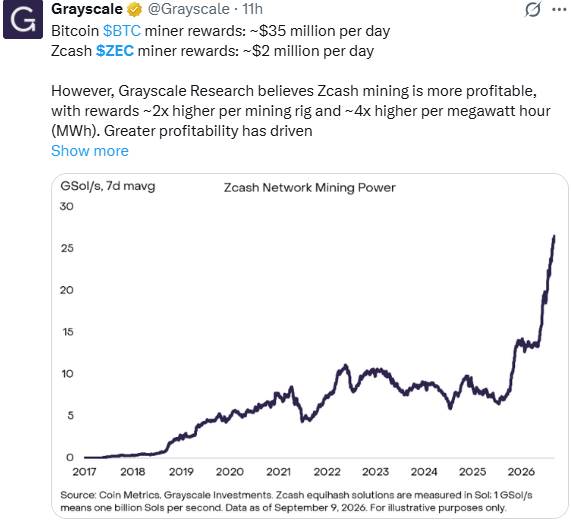 The mining power of the Zcash network will also increase significantly in September 2026. CoinGabbar was unable to independently verify Grayscale's profit estimates.
ZEC giant whale accumulation drives cryptocurrency market heated debate
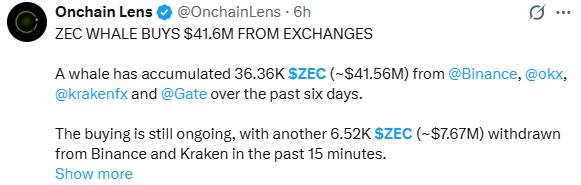
According to Onchain Lens, in the past six days, a giant whale wallet has purchased a total of 36,360 $ZECs, worth approximately US$41.6 million, from exchanges such as Binance, OKX, Kraken and Gate. During a recent 15-minute window, another 6,520 ZECs were withdrawn from the exchange and buying activity continued.
 $ZEC Price Forecast Chart: Technical Analysis
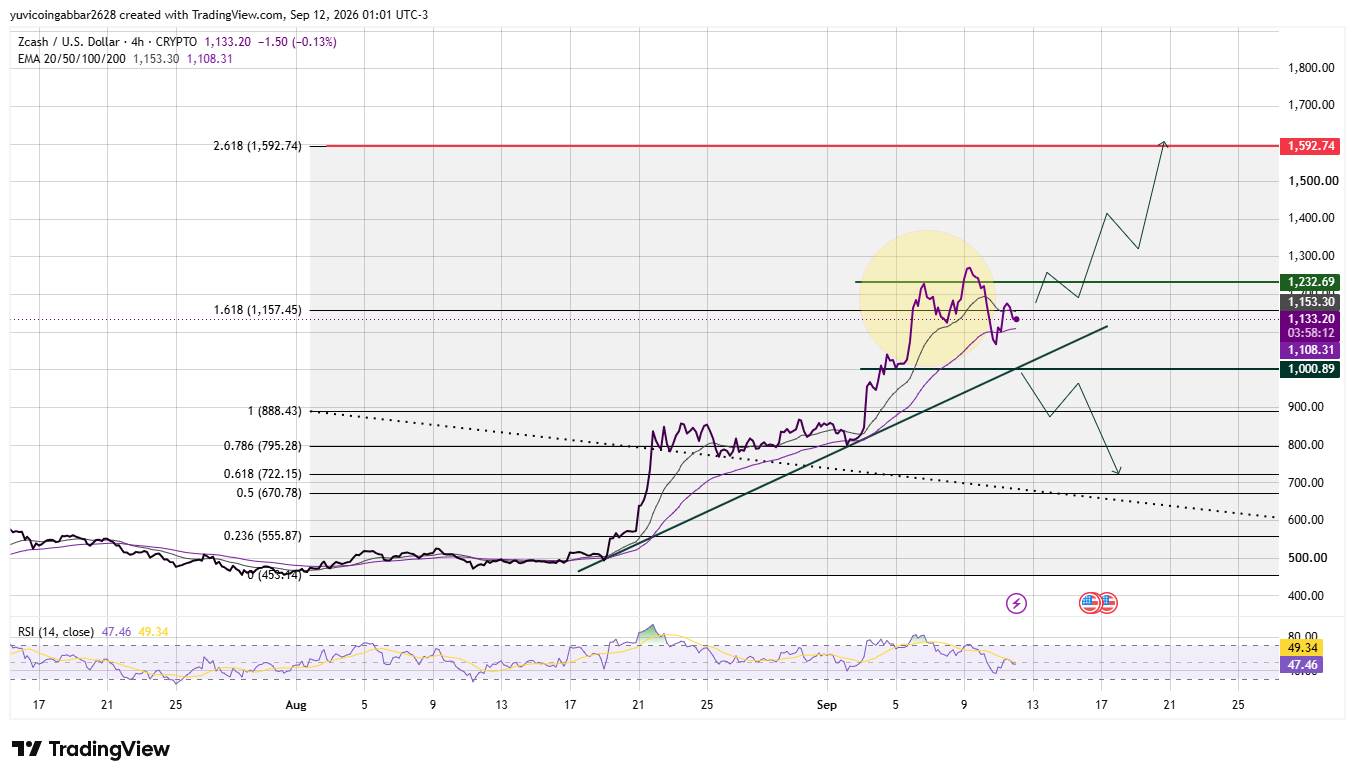
Trading Pair: ZEC/USD ·Market: Spot (Aggregate TradingView Index)·Time Frame: 4 hours·Timestamp: September 12, 2026 01:01 UTC
$ZEC trading price is $1,133.20, below the Fibonacci Extended Cluster after a strong multi-week rally. The RSI readings ranged from 47.46 to 49.34, in neutral territory and cooling from recent highs rather than overbought conditions.
The key point to pay attention to is whether the price holds the trend line or falls below it, which will determine the next trend.
 $ZEC Key Observation Levels: Support and Resistance Outlook
Horizontal Type Price Resistance Level 3 (2.618 Expansion)$1,592.74 Resistance Level 2$1,232.69 Resistance Level 1 (Recently, 1.618 Expansion)$1,157.45 Instant Price Reference $1,133.20 First Confirmed Support $1,000.89 Deep Support (1.0 Fibonacci)$888.43 Structural Bottom (0.786 Fibonacci)$795.28 ZEC Forecast: Bull Scenario vs Bear Scenario
Bull Scenario: If the price remains above the $1,000.89 support and breaks through the EMA cluster near $1,108 to $1,153, then $ZEC is expected to hit the resistance areas of $1,157.45 and $1,232.69, with ETF inflows and continued whale accumulation providing fuel for the rally.
Bear market scenario: A fall below $1,000.89 for would expose a level of $888.43 and call into question recent breakthroughs. The rise in long liquidations in the past few hours, coupled with the RSI slipping below 50, suggests momentum is weakening. Although the ETF and whale narrative remains bullish, if support falls, the possibility of a deeper correction towards $795.28 cannot be ruled out.
$ZEC trigger conditions and failure points
Scenario trigger conditions may result failure point EMA recovers to close above $1,153.30 and push to $1,232.69 and fall back back to $1,108.31 Lower support level holds from $1, The 000.89 rally range extends to resistance level and closes below $1,000.89 Support level breaks below $1,000.89 and slides below $888.43 Recovers $1,000.89 $Can ZEC reach $1,592.74?
$1,592.74 is the highest resistance level marked on the chart, which is the 2.618 Fibonacci extension. To achieve this goal,$ZEC first needs to clear $1,157.45 and $1,232.69 and stand firm on both, which cannot be achieved in one step.
Soaring Zcash prices spark discussion of popular cryptocurrencies
One trader pointed out that $ZEC rose from about $16 to about $1,294 in 25 months, an increase of nearly 8,000%, and suggested that the next 80-fold potential target in the cryptocurrency market may already be in silent trading while most people are looking elsewhere.
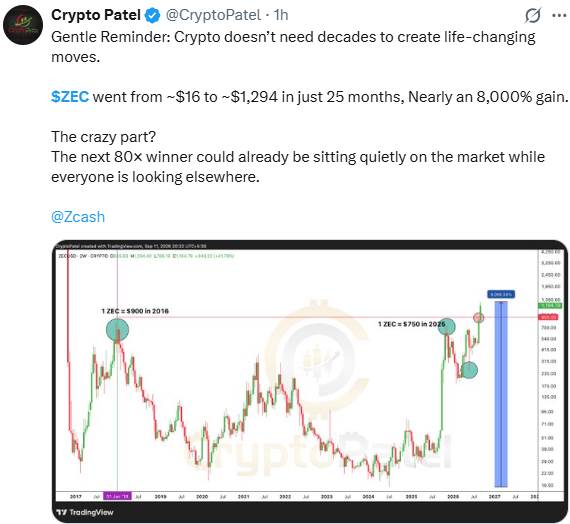 Note: CoinGabbar cannot independently verify this forward-looking statement and does not constitute investment advice.
Zcash 2026 price forecast: Expert opinion
According to CoinGabbar analysts, ETF capital inflows and giant whale accumulation are the most obvious bullish signals at present, but the recent increase in long clearing volume and the softening of RSI indicate that the rally needs to be suspended. The level to watch for this week is in the range of $1,000.89 to $1,157.45.
Disclaimer
This document is for reference only and does not constitute financial advice. The above levels and scenarios are based on technical chart analysis and publicly available data at the time of writing, and the cryptocurrency market can fluctuate violently within hours, so past patterns do not guarantee future results. Before taking any action, it is worth conducting independent research and considering your own risk tolerance.