Exchange Ranking
 Top Exchanges
 24h Volume Ranking
 Popularity Ranking
 Exchange BTC Balance
 Proof of Reserves
 Decentralized Exchanges
 Funding Rate
 Funding Heatmap
 Liquidation Data
 Max Pain
 Long/Short Ratio
 Whale L/S Ratio
 Binance/Okex/Huobi L/S
 Bitfinex Margin L/S
 ETF Tracker
 Solana ETF
 XRP ETF
 Hong Kong ETF
 Bitcoin Treasuries
 Crypto Reversal
 Ethereum Reserves
 HyperLiquid Wallet Analysis
 Hyperliquid Whale Watch
 Large Transactions
 On-chain Movement
 Bitcoin ROI
 Stablecoin Market Cap
 Options Analysis
 News
News Articles
 Economic Calendar
 Features
 Wallet
 Contract Calculator


 Security
 Collections
 Watchlist
 Following
 ZEC
ZEC Zcash 今日价格急剧降温,Grayscale 加速其 Zcash ETF 新闻周期
Zcash 今日价格显著回落,而 Grayscale 正在推动其 Zcash ETF 的新闻热度。该基金计划在纽约证券交易所(NYSE)上市不到一个月后实施 1 拆 3 的股本拆分,且管理资产规模已迅速达到 8.43 亿美元。Zcash 当前交易价格为 1,456.11 美元,今日下跌 5%,处于一个陡峭的上升通道内。本预测将探讨 ETF 的动能是否能抵消图表中开始显现的阻力。
市场数据截至 2026 年 9 月 20 日。
Zcash 今日价格预测:市场概况
指标数值 价格$1,456.11 24小时变化-5% 日内区间$1,438.41 – $1,478.35 Zcash 今日新闻:Grayscale ETF 计划实施 1 拆 3 股本拆分
Grayscale 的 Zcash ETF 计划在纽约证券交易所上市不到一个月后实施 1 拆 3 的股本拆分,且该基金的管理资产规模已吸引至 8.43 亿美元。 对于如此新颖的产品而言,这是快速增长,表明机构投资者对受监管的 ZEC 敞口表现出强劲的早期需求,尽管具体的拆分时间表尚未确认。
Zcash 新闻:ZEC 清算严重偏向多头
Total window clearing amount Long short 1 hour $175.66K $170.62K $5.04K 4 hours $472.90K $218.89K $254.01K 12 hours $3.36M $2.45M $912.11K 24 hours $11.45M $8.31M $3.14M Long accounted for approximately 73% of the 24-hour clearing amount, which means today's correction caught the bulls off guard rather than squeezing the shorts. This suggests that after a steep rally, there has been real profit-taking rather than a reverse short covering.
Zcash Technical Analysis
ZEC, which has been climbing in a steep rising channel since late July, is currently falling back from recent highs near US$1,478 to the middle of the channel, opening at US$1,470.20 and is now US$1,456.11.
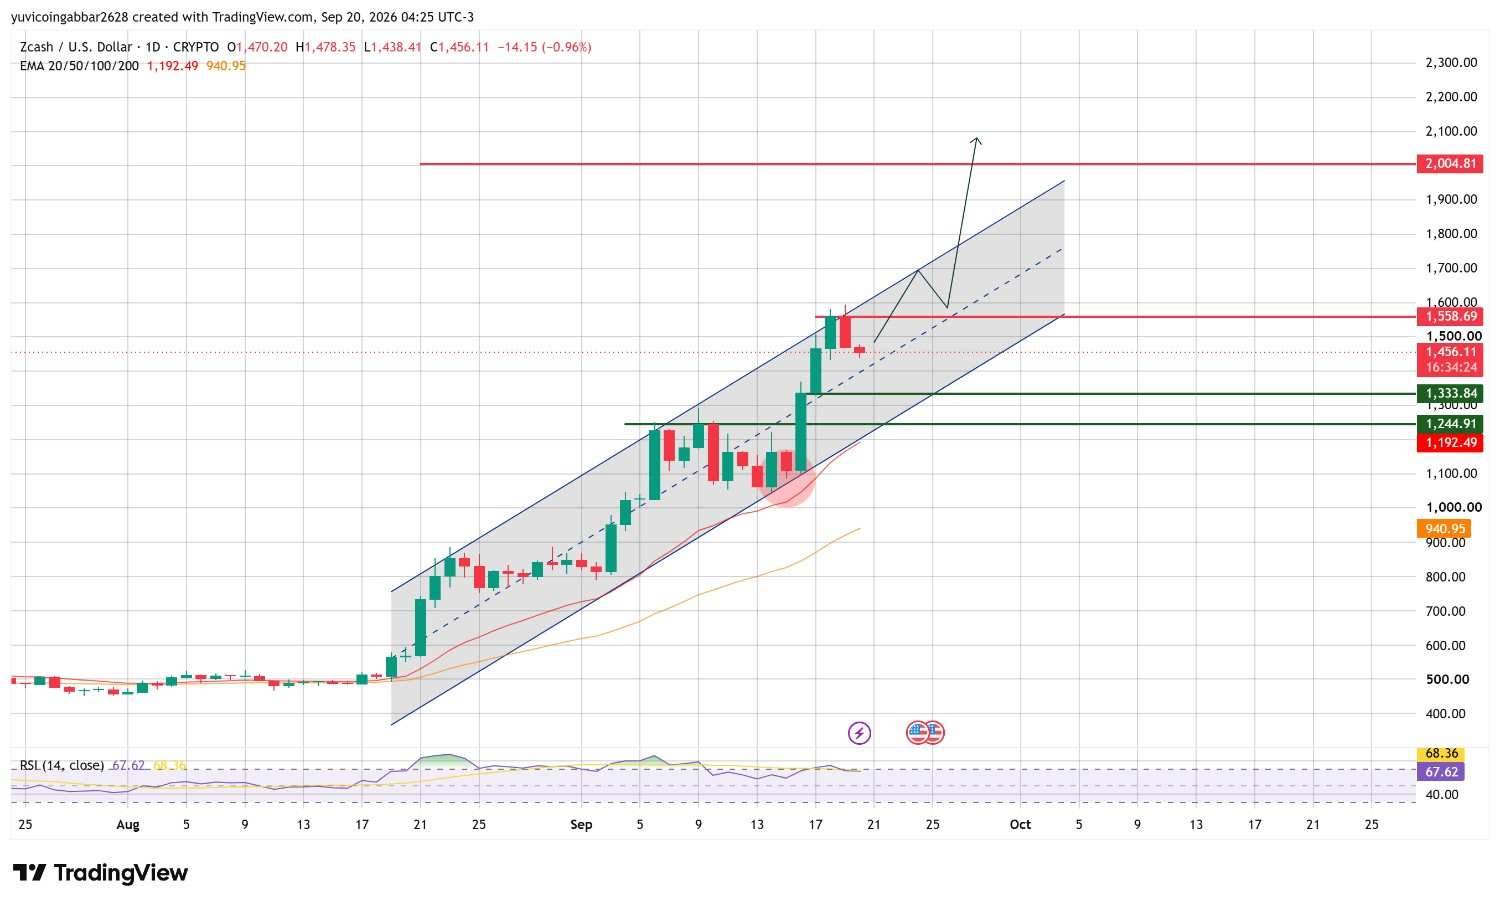 The RSI, a momentum indicator that measures the speed and magnitude of price movements, is at 67.62, close to the 70 level that is usually considered overbought. This is consistent with today's correction looking like a natural cooling point after an overheated market, rather than a trend reversal.
The EMA cluster is located further below, between US$940.95 and US$1,192.49, which reminds us that this market has been very extended. If ZEC holds the channel and breaks through $1,558.69, the chart's own forecast path points further to $2,004.81.
Zcash prediction: support level
US$1,333.84 is the first support level to focus on, the lower boundary of the current channel structure. Below this, US$1,244.91 and the EMA cluster near the US$1,192.49 mark constitute deeper support.
Zcash Outlook: Resistance level
US$1,558.69 is the most recent resistance level, located near the upper edge of the rising channel. Breaking through it would open the way to $2,004.81, the chart's larger goal.
What happens next? Key triggers and failure levels
Scenario triggers Possible outcomes Failure conditions channel remained above US$1,333, exceeded US$1,558.69, pushed higher to US$2,004.81, closed below US$1,244.91, and the range cooled down in the US$1,333 - 1,558 range consolidated to lay the foundation for the next action.$192.49 crashes to close below $1,244.91, slips towards EMA support and recovers $1,333.84 Zcash price forecast: Can Zcash hit $2,004?
If ZEC holds on to the rising channel and breaks through US$1,558.69, it is possible to reach this target, which is based on the chart's own forecast path. Given that the RSI is close to overbought status, further cooling down before the movement occurs would be a healthier setting than an immediate upward push.
Zcash 2026 Price Forecast: Expert Opinion
According to analysts at CoinGabbar, the ETF split news is a truly bullish long-term signal, but the chart tells a short-term story: a market that has rallied too strongly and is panting.
$1,333.84 is a critical level: holding it keeps the channel intact, while losing it suggests that this cooldown is turning into a larger adjustment.