Exchange Ranking
 Top Exchanges
 24h Volume Ranking
 Popularity Ranking
 Exchange BTC Balance
 Proof of Reserves
 Decentralized Exchanges
 Funding Rate
 Funding Heatmap
 Liquidation Data
 Max Pain
 Long/Short Ratio
 Whale L/S Ratio
 Binance/Okex/Huobi L/S
 Bitfinex Margin L/S
 ETF Tracker
 Solana ETF
 XRP ETF
 Hong Kong ETF
 Bitcoin Treasuries
 Crypto Reversal
 Ethereum Reserves
 HyperLiquid Wallet Analysis
 Hyperliquid Whale Watch
 Large Transactions
 On-chain Movement
 Bitcoin ROI
 Stablecoin Market Cap
 Options Analysis
 News
 Articles
 Economic Calendar
 Features
 Wallet
 Contract Calculator


 Security
 Collections
 Watchlist
 Following
 BTC
Overview of Bitcoin Price Forecasts
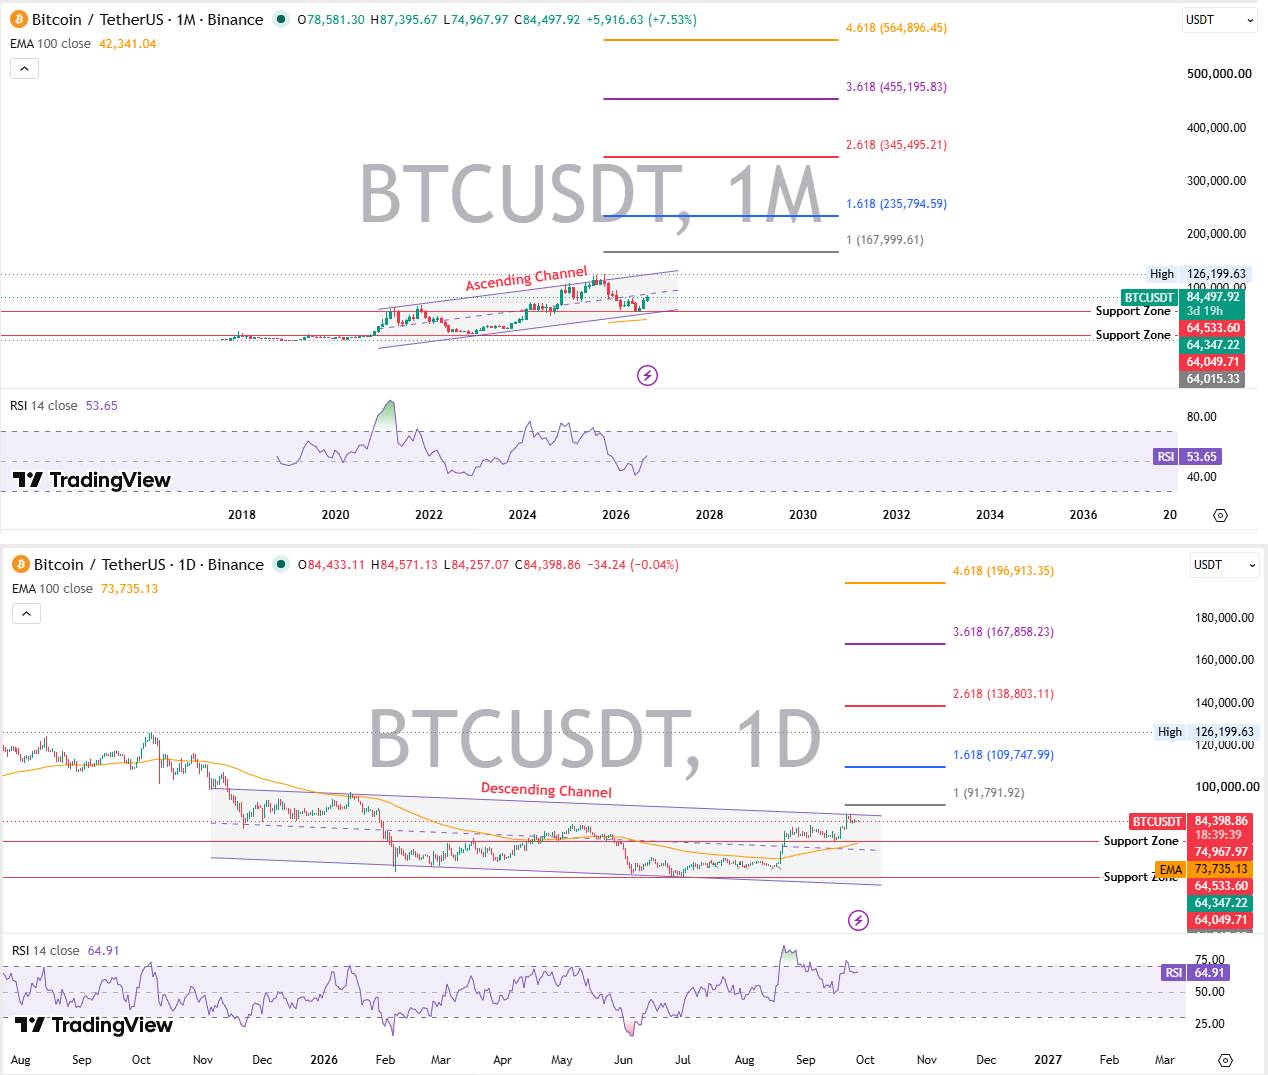
As of September 27, 2026, 18:38 UTC, the Bitcoin trading price is approximately US$84,400. The daily chart shows a downward channel, while the monthly structure shows that the upward channel remains intact. This Bitcoin price forecast covers the next seven days and the outlook for 2026, with ETF demand being the biggest catalyst and falling below US$74,968 being the biggest risk.
Current prices and fundamentals
According to CoinMarketCap data, the current price of Bitcoin is US$84,373, up about 0.5% in the past 24 hours, and up nearly 3.85% in the seven days. The market value remained at US$1.69 trillion, while trading volume fell by more than 54%, which is part of the reason for the horizontal consolidation of BTC prices.
The indicator's current view trend is neutral, leaning towards bullish next target US$91,792 Support US$74,968 Resistance US$91,792 RSI (daily)64.91 Bullish scenario above US$126,200 Benchmark scenario 91,792 to US$100,000 Bear scenario 64, US$015 expiration conditions Daily closes below US$74,968 Bitcoin price forecast in the next 7 days
Prices are consolidating in the downtrend channel of the daily chart. Immediate support is at $84,257 and resistance is at $91,792, which is also the first Fibonacci extension.
Bullish scenario
If Bitcoin breaks through US$91,792 on real volume, the next target will be US$100,000, followed by a quick look towards US$109,748, the "short squeeze" setting that traders are focusing on.
Bear scenario
If US$74,968 is broken below, the target range will point to 64, 533 to 64,015. The region has provided support twice in this cycle.
Technical Analysis
 Trend Analysis
Short-term trading remained volatile in the downtrend channel. But the monthly uptrend channel from the 2022 low remains intact, and the weekly structure reflects this tug-of-war.
Support level
S1 is at US$74,968. S2 is located at 64, US$533. S3 is located at 64, US$015.
Resistance level
R1 is at US$91,792. R2 is located at $109,748. R3 is at $126,200, an all-time high in October 2025.
RSI analysis
The daily RSI reading is 64.91, which is stable but not overbought. The monthly RSI reading was only 53.65. This means there is still room before momentum stretches in any direction.
MACD analysis
The daily line MACD is above the signal line, with a value of 2,433 versus 2,217. The monthly MACD remains below the signal line, a lagging response to the 2025 correction.
Volume analysis
Basically, the rebound lacks strong confirmation. Binance alone accounted for more than US$625 million in spot transactions.
Breakthroughs and Declines
突破91,792美元将打开通往109,748美元的大门。跌破74,968美元将打开64,000美元区间的下行空间。
看涨、基准与看跌情景表
情景概率目标价市值触发条件失效条件 看跌25%64,015美元1.29万亿美元失去74,968美元支撑重新站上84,000美元 基准45%91,792至100,000美元1.85万亿至2.01万亿美元区间持续盘整突破任一边界 看涨30%126,200美元+2.54万亿美元+放量收于91,792美元之上未能守住84,000美元 什么可能推动比特币价格上涨?
ETF需求
据SoSoValue追踪数据显示,2026年9月25日UTC时间00:00,现货比特币ETF录得1.3447亿美元的净流入,标志着连续七天出现接近29.7亿美元的流入。
机构采用
 据Bitcoin News报道,Strategy目前持有846,000枚BTC,Strive持有26,355枚BTC,两者本周均增加了2,305枚BTC。上市公司共持有127.3万枚BTC,Michael Saylor在X上呼吁MSTR数字股权。
流动性与利率
国债回购有助于提升风险偏好。此外,十月季节性因素在过去13年中的10年里对比特币有利。
比特币供应与减半周期
流通供应量为2,008万枚,最大供应量2,100万枚,这种稀缺性常被新手投资者低估。
监管动态
白宫官员表示,建立“战略比特币储备”成为法律的可能性“相当大”,这为2026年之后的长期价格路径情景提供了动力。
什么可能推动比特币价格下跌?
宏观风险
比特币年初至今收益率为-3.60%,这与更广泛的风险复杂体所驱动的整体加密市场驱动力相同。
ETF流出
9月15日出现了近4.5亿美元的流出;这证明了资金流向是可以逆转的。
杠杆与清算
根据CoinGlass数据,未平仓合约金额接近753.4亿美元,下降了1.28%。24小时内清算总额达892万美元,资金费率低至0.0027%。
关键支撑失败
日线收盘低于74,968美元将迅速使结构转向看跌。
避险情绪
股票或债券中的避险运动往往首先拖累加密货币下跌。
链上与市场数据
活跃地址降至449,000个,下降13.7%,网络费用下降36.1%。交易数量上升26.5%至757,000笔,哈希率保持在1,016.3 EH/s附近,证明了交易验证工作继续保持可扩展性。关键在于:地址减少但交易增加,表明是大型玩家而非散户回归。
2026年比特币价格预测
看跌情景:若支撑失败,价格为64,015美元。
基准情景:随着ETF需求吸收供应,持续盘整,价格为91,792至100,000美元。
看涨情景:如果储备法案推进,价格为126,200美元及以上,这是本网站更广泛价格预测覆盖的一部分。失效位设在64,015美元以下。
2027-2030年比特币价格预测
年份看跌基准看涨市值范围主要驱动因素 202764,015美元109,748美元167,858美元1.29T至3.39T市场周期 202874,968美元167,999美元235,795美元1.52T至4.79T减半 202991,792美元235,795美元345,495美元1.87T至7.05T周期扩张 2030109,748美元345,495美元564,896美元2.25T至11.58T采用与流动性 市值数据假设随着2028年减半进一步减缓新发行量,流通供应量从2,008万枚逐渐攀升至2,050万枚BTC。
本比特币价格预测的工作原理
该框架结合了市场结构、多时间框架技术面、链上数据、衍生品、ETF资金流、宏观背景以及日益增长的比特币DeFi活动,然后对每种情景进行加权,并设定明确的失效水平。
比特币能否达到100,000美元?
是的,而且不远。如果在真实成交量下突破91,792美元,同时比特币主导地位趋势上升,100,000美元触手可及。在100,000美元时,基于当前流通供应量,市值约为2.01万亿美元。
比特币能否达到150,000美元?
有可能,但仅凭当前的设置还不足以实现。它需要储备法案通过,并且资金流入在2027年和2028年持续复利。该水平意味着市值接近3.03万亿美元,远高于比特币目前的1.69万亿美元。
比特币能否达到100万美元?
在任何近期时间线上都不太可能。这需要远超当前需求的结构性转变。100万美元的价格意味着市值接近20.60万亿美元,大于今天黄金的全部地上价值。值得关注,但目前不值得定价计入。
比特币价格预测风险
此处所有预测均为概率性的,而非确定的。宏观状况可能会毫无预警地发生变化,技术级别也可能失效。意外监管事件(跟踪在最新的加密货币新闻更新中)可能会使上述任何情景失效。
交易者摘要
- 高于91,792美元:看涨结构保持完好。
- 介于74,968美元和91,792美元之间:区间继续。
- 低于74,968美元:看跌失效,打开64,533美元的空间。
- 高于109,748美元:下一个目标接近126,200美元变得相关。