Exchange Ranking
 Top Exchanges
 24h Volume Ranking
 Popularity Ranking
 Exchange BTC Balance
 Proof of Reserves
 Decentralized Exchanges
 Funding Rate
 Funding Heatmap
 Liquidation Data
 Max Pain
 Long/Short Ratio
 Whale L/S Ratio
 Binance/Okex/Huobi L/S
 Bitfinex Margin L/S
 ETF Tracker
 Solana ETF
 XRP ETF
 Hong Kong ETF
 Bitcoin Treasuries
 Crypto Reversal
 Ethereum Reserves
 HyperLiquid Wallet Analysis
 Hyperliquid Whale Watch
 Large Transactions
 On-chain Movement
 Bitcoin ROI
 Stablecoin Market Cap
 Options Analysis
 News
News Articles
 Economic Calendar
 Features
 Wallet
 Contract Calculator


 Security
 Collections
 Watchlist
 Following
 ETH
ETH Key insights
Ethereum prices remain above $2370, and leveraged positions expand.
ETH futures activity is still much larger than spot trading volume.
Resistance near US$2396 may determine the next short-term trend.
On August 21, Ethereum prices remained above $2370 after a strong rebound cleared previous resistance. TradingView's 1-minute ETH/USD chart shows that the price at 04:04 UTC is US$2,376.1. This trend has maintained positive momentum, while leverage data suggests that liquidation risks are rising.
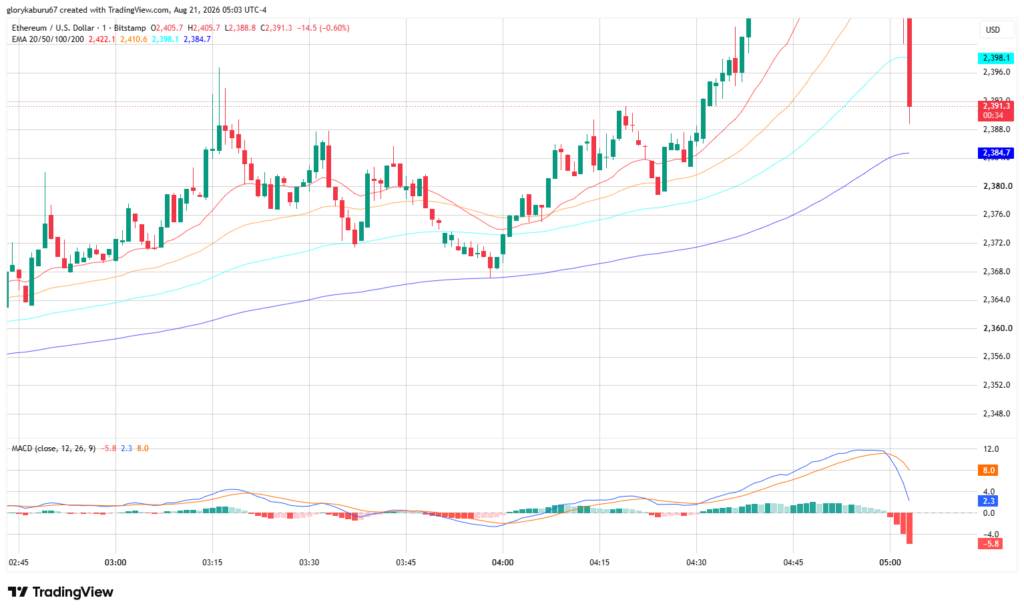 Ethereum Price Chart
This increase is important because derivatives activity is expanding much faster than spot trading volume. This imbalance exposes ETH to more severe intraday fluctuations when leveraged traders withdraw collectively. Ethereum's broader network roadmap does not provide any immediate market catalyst during trading hours.
Ethereum prices keep rising, trading activity accelerates
CoinGlass data shows that during the trading session on August 21, 2026, the trading price of ETH was close to US$2334. The platform measured an intraday increase of 3.02% and a seven-day increase of 23.82%, with the market value of Ethereum close to US$283.06 billion. CoinGlass recorded 24-hour spot trading volume of US$5.07 billion, while futures trading volume reached US$74.22 billion during the same period. This gap suggests that derivatives traders have dominated short-term activity in recent price fluctuations. CoinGecko historical data shows that ETH closed at $1,877.74 on August 12. The price then exceeded $2300, following a rapid revaluation of levels in mid-August. TradingView's ETH chart showed that buyers briefly pushed ETH higher to $2396 before the market fell back. Ethereum Foundation records show that no new protocol upgrades were launched during the August 21 trading session. The official roadmap still lists GlamAmsterdam in the second half of 2026. This time point indicates that the current price movement comes from position adjustments rather than the day's network upgrade.
Ethereum price structure keeps bulls above key moving average
The TradingView chart shows that ETH is above all four displayed exponential moving averages. The 20-cycle moving average is close to $2,374.8, the 50-cycle moving average is approximately $2,375.7, and the 100-cycle and 200-cycle moving average are close to $2,373.5 and $2,367.6 respectively. This configuration keeps the intraday structure constructive, but the moving averages remain closely clustered. This compression reduces the distance between the support and failure bits. A break below this cluster could quickly weaken the recent rebound. The Moving Average Convergence/Divergence Indicator (MACD) also improved on the right edge of the chart. Its histogram turned to positive 0.7 after several consecutive negative values, but the MACD line was still below zero, limiting the confirmation of kinetic energy. New York University's Volatility Laboratory had recorded an increase in Ethereum's volatility before the breakthrough. Its model on August 14 estimated the one-month volatility at 48.27%, which is 6.98% higher than the previous observation. This background supports caution about short-term directional trading. Higher volatility may widen the intra-day range but does not confirm a continuation of the trend. Therefore, the current chart is conducive to momentum, but not a low-risk entry point.
Ethereum prices face leverage risk after short clearing
CoinGlass measured that Ethereum open interest was close to US$30.6 billion during the trading session. The platform also reported approximately US$184.19 million in 24-hour ETH futures clearing volume. These data suggest that leverage remains high after the rebound. Cryptocurrency analyst CW posted on X that during the rise, highly leveraged short positions continued to form. The trader also observed an increase in leveraged long positions. If volatility accelerates, this combination will increase both parties 'exposure.
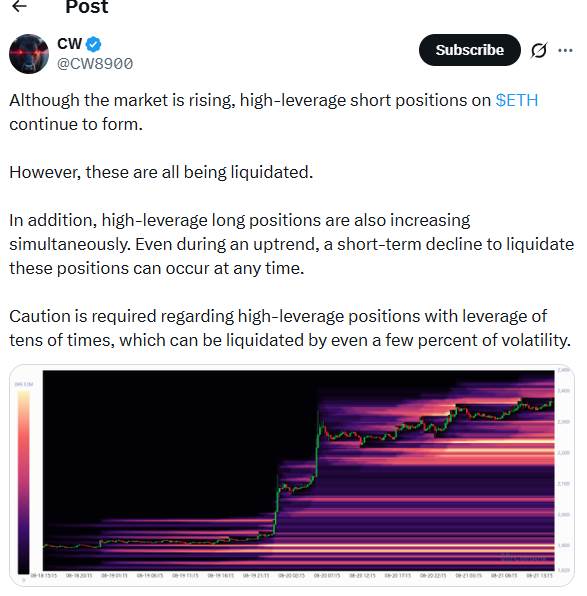 Ethereum's highly leveraged short positions
Rain, another market analyst, said that ETH has broken through the US$1980 to US$2000 resistance zone. The analyst described $2000 as the next level that requires support confirmation. The region is well below the current market, leaving room for a deeper correction. Crypto Tony confirmed the recent range high as the next upper area to be tested. The TradingView chart shows immediate resistance around $2388 to $2396. A clean breakthrough in the area will extend the intraday rebound structure.
Ethereum focuses on US$2367 support and US$2396 resistance
Recent support is around the 200-cycle exponential moving average of US$2,367.6. The TradingView chart also shows repeated trading around $2374 to $2376. Losing the cluster would expose earlier intraday lows near $2360. Resistance remains concentrated near the upper shadow line of the trading session, at about $2396. The broader $2400 area will become the next visible test point above that level. Traders also face high derivatives positions before confirming that the trend continues. The next agreement milestone for Ethereum remains Glamstam, which is scheduled to be implemented in the second half of 2026. Prior to this, Ethereum prices were more directly determined by liquidity, leverage and broader cryptocurrency flows. The next technical decision revolves around the game between support at $2367 and resistance at $2396.