Exchange Ranking
 Top Exchanges
 24h Volume Ranking
 Popularity Ranking
 Exchange BTC Balance
 Proof of Reserves
 Decentralized Exchanges
 Funding Rate
 Funding Heatmap
 Liquidation Data
 Max Pain
 Long/Short Ratio
 Whale L/S Ratio
 Binance/Okex/Huobi L/S
 Bitfinex Margin L/S
 ETF Tracker
 Solana ETF
 XRP ETF
 Hong Kong ETF
 Bitcoin Treasuries
 Crypto Reversal
 Ethereum Reserves
 HyperLiquid Wallet Analysis
 Hyperliquid Whale Watch
 Large Transactions
 On-chain Movement
 Bitcoin ROI
 Stablecoin Market Cap
 Options Analysis
 News
News Articles
 Economic Calendar
 Features
 Wallet
 Contract Calculator


 Security
 Collections
 Watchlist
 Following
 BTC
BTC Bitcoin is approaching the "Golden Cross", but historical data reveals its limitations
Bitcoin is gradually approaching a long-tracked technical indicator-the "Golden Cross". As Bitcoin prices hover around $77,819.21, historical data shows that this classic signal has not always led to strong gains in the past. However, in addition to providing a technical perspective, the USDT, the largest dollar-denominated stablecoin in the market, also sent a compelling new signal.
The so-called "golden cross" refers to the pattern formed when the 50-day moving average of the price of an asset crosses the 200-day moving average upwards. This structure suggests that short-term price momentum outweighs longer-term trends and is therefore often seen by investors as a sign of a potential long-term uptrend.
It should be pointed out that the 50-day and 200-day cycles have no special mathematical significance. These time spans became the norm because they were used for generations in stock, bond and commodity markets before being introduced into the cryptocurrency market.
Why doesn't a gold crossing always bring gains?
Although gold crosses are one of the oldest and most popular bullish indicators in financial markets, they have one significant flaw: because moving averages are calculated based on past price data, they reflect lagging information rather than predictions of current trends.
This means that prices may have risen significantly by the time the signal comes. Bitcoin's historical performance also confirms that gold crosses alone as an independent buying signal are not reliable.
 How has Bitcoin performed in history after the gold cross?
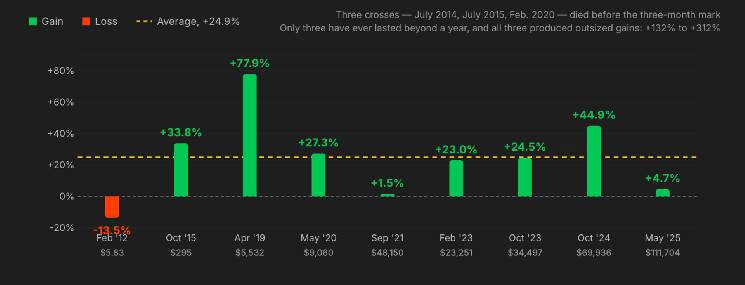
Since 2012, Bitcoin has experienced a total of 12 golden crossings on the 50-day moving average that cross the 200-day moving average. However, only three of these led to long-term and strong gains.
After the first case emerged on February 9, 2012, Bitcoin rose 306% in a year. Another gold cross in October 2015 remained valid for more than two years, coinciding with Bitcoin soaring to a then-record bull market of about $19,800 in December 2017.
The May 2020 Gold Crossover also brought significant results. Bitcoin increased in value by 312% in the following 12 months and climbed further to approximately $64,900 in subsequent stages.
In contrast, the efficacy of some signals quickly fades. The two golden crosses that occurred in July 2014 and July 2015 were both invalidated within two months due to the emergence of "Death Cross", and failed to even maintain the three-month effective evaluation period.
What do cryptocurrency market statistics reveal?
Similar situations occurred repeatedly in the subsequent period. Some gold crosses brought in more than 40% gains in three months, but were lapsed before the year came due to death crosses.
For example, the September 2021 case produced only a slight increase of 1.5%. The signal failed a few months later, and Bitcoin fell more than 70% from its high point in the following year.
Looking at the overall data, the results are more balanced. Among the nine gold cross cases where a three-month return could be calculated, the average yield was 24.9%. However, of the twelve golden cross cases, only three were not disturbed by death crosses throughout the year.
In these three success cases, the average annualized rate of return reached 250%. It can be seen that the gold cross may serve as a meaningful momentum indicator in the short term, but its effectiveness in confirming long-term upward trends is much rarer.
Why is USDT so important to Bitcoin's gold crossover?
Therefore, investors should not view the new gold cross signal in isolation, but should consider it comprehensively in conjunction with stablecoin liquidity, trading volume and overall market conditions. Trends in USDT can be used as an important reference signal to reflect potential liquidity inflows into the market in addition to technical indicators.
If a gold cross occurs, rather than treating it as an automatic buy order, it is better to adopt a more prudent strategy: continue to track the 50-day and 200-day moving averages to confirm whether the trend continues.