Exchange Ranking
 Top Exchanges
 24h Volume Ranking
 Popularity Ranking
 Exchange BTC Balance
 Proof of Reserves
 Decentralized Exchanges
 Funding Rate
 Funding Heatmap
 Liquidation Data
 Max Pain
 Long/Short Ratio
 Whale L/S Ratio
 Binance/Okex/Huobi L/S
 Bitfinex Margin L/S
 ETF Tracker
 Solana ETF
 XRP ETF
 Hong Kong ETF
 Bitcoin Treasuries
 Crypto Reversal
 Ethereum Reserves
 HyperLiquid Wallet Analysis
 Hyperliquid Whale Watch
 Large Transactions
 On-chain Movement
 Bitcoin ROI
 Stablecoin Market Cap
 Options Analysis
 News
News Articles
 Economic Calendar
 Features
 Wallet
 Contract Calculator


 Security
 Collections
 Watchlist
 Following
 DOGE
DOGE  ETH
ETH DOGE Price Analysis
DOGE prices are currently hovering around US$0.083. The short-term average is lower than the long-term average. DOGE, the first and most well-known dog-themed token, hit a high of US$0.1007 on August 22, and subsequently retreated more than 17% to current levels. As of press time, the trading price of the meme coin was US$0.08318, an intraday increase of more than 3%, and the transaction volume reached US$594.58 million. It is worth noting that the 24-hour trading range is US$0.08067 -0.08359, and the 7-day range is US$0.08021 -0.0902.
Importantly, the Tom DeMark sequence flashed a buy signal, marking the end of the DOGE adjustment phase. At the same time, the Morningstar cross appears on the daily chart. This is a bullish reversal pattern that is common at the end of the downtrend, when selling pressure weakens and buyers begin to enter.
In addition, in the past five days, large households have increased their holdings of more than 400 million DOGE units. This is not a bargain-hunting by individual investors, but the firm confidence of the whale level at the current price.
Where is the momentum of DOGE going?
The US$0.0813 support level is the key line to maintain the entire pattern. Nearly 35 billion DOGE units have previously been traded near this level, making it an important bottom. As long as the support level is held, the bullish stance remains. On the upside side,$0.1552 is the first key target, followed by $0.1774 is the next major resistance level. The $0.0813 level determines whether this is a reversal or just a temporary rebound.
The 4-hour chart shows that the Moving Average Convergence and Divergence Indicator (MACD) line crosses up the signal line, but both lines are below the zero axis. This suggests a bullish rebound attempt in the overall downtrend. The market background is short, and the short-term moving average is lower than the long-term moving average. Buyers are trying to push up DOGE prices. At the same time, it also gives an early warning signal that the downtrend is weakening. However, since both lines are below the zero axis, the risk is higher; traders often view this as a potential trend reversal. 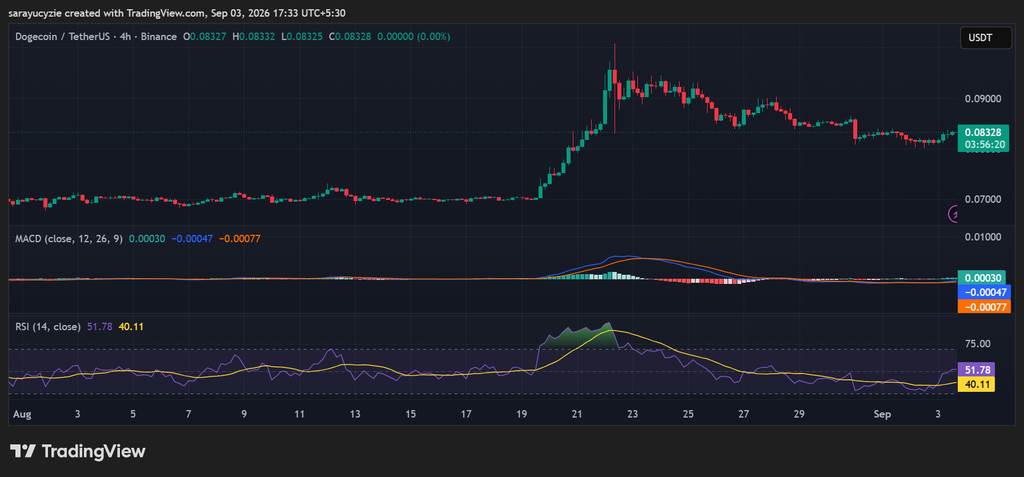 (Source: TradingView) In addition, the daily Relative Strength Index (RSI) read at 51.78, indicating that the market is completely neutral. This shows that neither long nor short positions dominate the price trend. In the recent K-line, the increase is slightly greater than the decline, but the difference is negligible. This value reflects that the market is in equilibrium. In addition, traders are concerned about the RSI breaking through 60 to confirm accelerating momentum, or falling below 40 to indicate that bears are in control of the situation.