Exchange Ranking
 Top Exchanges
 24h Volume Ranking
 Popularity Ranking
 Exchange BTC Balance
 Proof of Reserves
 Decentralized Exchanges
 Funding Rate
 Funding Heatmap
 Liquidation Data
 Max Pain
 Long/Short Ratio
 Whale L/S Ratio
 Binance/Okex/Huobi L/S
 Bitfinex Margin L/S
 ETF Tracker
 Solana ETF
 XRP ETF
 Hong Kong ETF
 Bitcoin Treasuries
 Crypto Reversal
 Ethereum Reserves
 HyperLiquid Wallet Analysis
 Hyperliquid Whale Watch
 Large Transactions
 On-chain Movement
 Bitcoin ROI
 Stablecoin Market Cap
 Options Analysis
 News
News Articles
 Economic Calendar
 Features
 Wallet
 Contract Calculator


 Security
 Collections
 Watchlist
 Following
 BTC
BTC Key insights
The "golden cross" signal in Bitcoin prices signals further gains, but of the 12 times in history, only 3 have been successful in the long term.
The probability of the Federal Reserve raising interest rates has risen to 60%, bringing short-term downside risks to Bitcoin.
Bitcoin prices traded around $78,000 on Thursday, fell on the day, and failed to close above $80,000 for the second consecutive week.
The recent bullish market has accompanied the 50-day moving average on the BTC daily chart crossing the 200-day moving average. This form is called the "golden cross" and is one of the most watched and popular technical forms in Bitcoin price forecasting. Most importantly, this is the first gold cross in Bitcoin since November 2025.
Why Bitcoin's gold cross signal is crucial
A gold cross occurs when an asset's short-term average price trend is higher than its long-term average trend. This suggests that recent buying momentum has surpassed long-term trends.
BTC prices have generated 12 such crossings since 2012, but the past record of this signal is quite mixed. Of the 12 crossovers, only 3 remained valid throughout the year, but those three produced an average return of 250% over that period.
Among the other nine crosses, the average increase was about 24.9%. The analysis also pointed out that the signal had triggered about three false alarms, a risk that limited the reliance on the model in Bitcoin price forecasts. 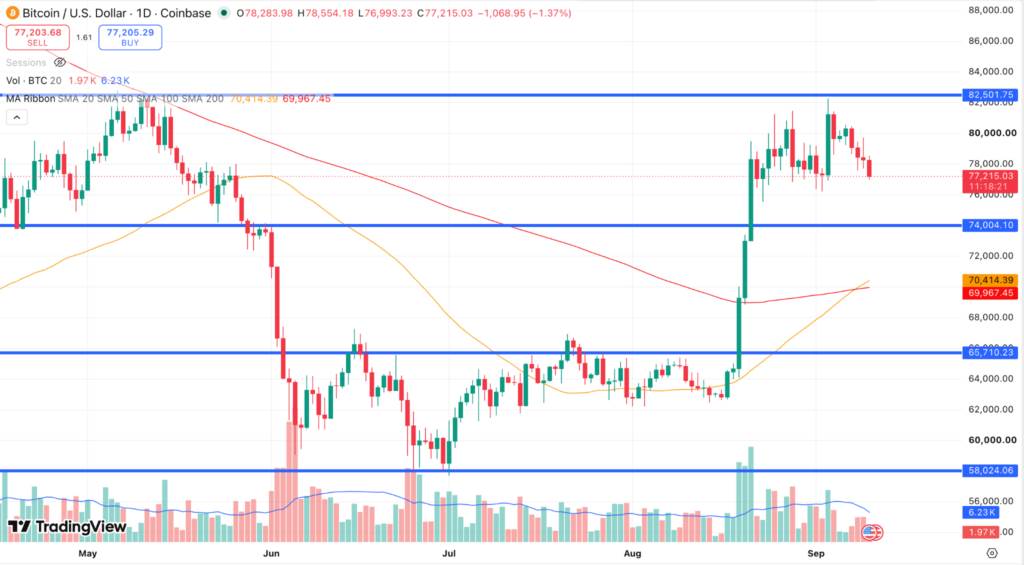
Bitcoin Price Forecast- 1-Day BTC Price Chart| Source: TradingView
Another indicator that supports the bullish view of Bitcoin is the proportion of the U.S. stablecoin USDT to the total crypto market capitalization. The ratio is currently around 8.45%, close to its potential reversal points at the 50th and 200th moving averages.
The rise in USDT dominance usually indicates that funds are flowing into stablecoins and withdrawing from bitcoin and altcoins. Conversely, the decline in USDT's share is seen as a positive for Bitcoin, as USDT is flowing into these assets. This indicator complements the gold cross setting and provides another bullish confirmation.
Interest rate hike expectations challenge Bitcoin price forecasts
The bullish technical form contrasts sharply with the macro background. The yield on the 10-year Treasury bond remained around 4.8% this week, while August's non-farm payrolls data was strong, with 162,000 new jobs created, much higher than the expected 55,000. Unemployment remained unchanged at 4.1%. 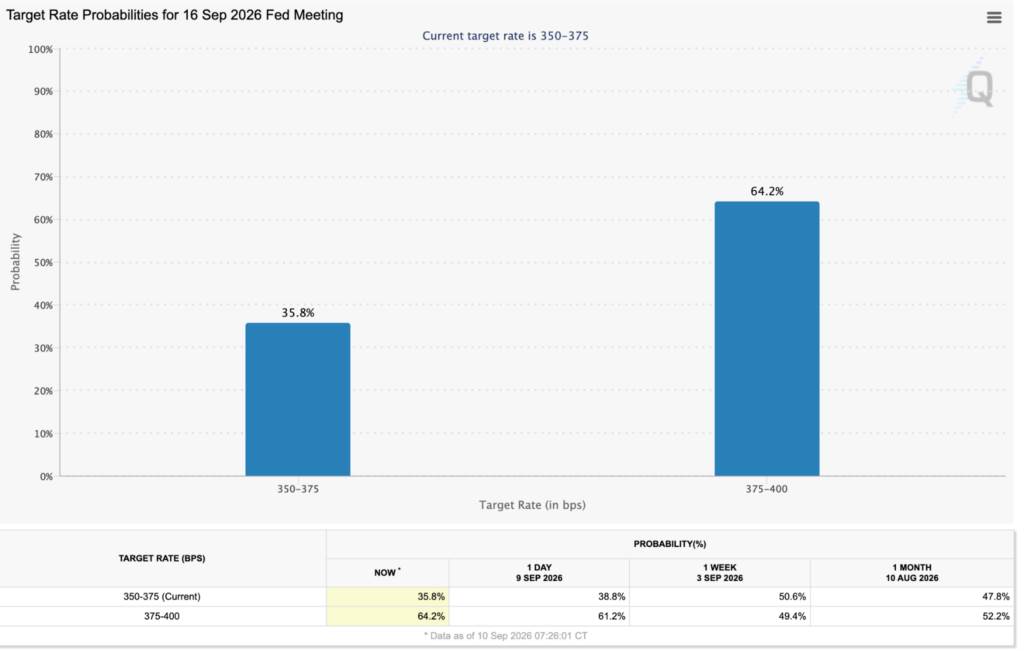
Source: Fed Watch
Strong non-farm data has increased expectations for a rate hike at the Federal Reserve's September 15-16 meeting, adding uncertainty to Bitcoin price forecasts. Analysts raised the probability of a 25 basis point rate hike from about 49 percent to about 60 percent, according to FedWatch tool data.
Research by UBS highlights a similar 60% probability. It pointed out that the employment report was the strongest monthly job growth since March.
In recent weeks, expectations for interest rate hikes have changed significantly. In early September, with Federal Reserve Governor Christopher Waller calling for patience before further rate hikes, the probability was about 50%. Later, after Kevin Walsh made hawkish remarks at the Jackson Hole Symposium in late August, the probability rose to as high as 64%. On Friday, strong jobs data again pushed up the probability of a rate hike.
Combining two signals to predict Bitcoin prices
Producer price index (PPI) data released on Thursday showed that core PPI rose 0.2% month-on-month, lower than the expected 0.3%. The overall PPI increased from 0.1% to 0.4%, in line with expectations of a sharp acceleration.
The number of initial jobless claims per week is 206,000, which is roughly in line with the expectation of 205,000. As PPI accelerated, BTC prices fell to support levels of around $77,000. Now, Friday's Consumer Price Index (CPI) report is the last major inflation data to influence the Fed's decision to raise interest rates. 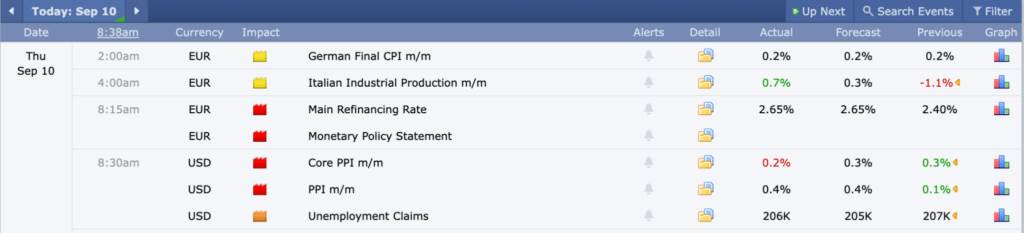
Source: Forex Factory
Historically, the results of the Golden Cross have been mixed, with only 3 out of 12 occurrences being reliable long-term signals.
The decline in BTC prices towards US$77,000 also suggests that bullish technical settings have not yet overcome the broader market macro environment.
Whether current signals lead to a sustained recovery or turn into a bull trap will largely depend on Friday's CPI report and its impact on the Federal Reserve's next interest rate decision, which will shape Bitcoin price forecasts.
At present, the technical outlook remains bullish. However, Bitcoin prices are trading near key support levels, and its next major move depends on unreleased economic data.