Exchange Ranking
 Top Exchanges
 24h Volume Ranking
 Popularity Ranking
 Exchange BTC Balance
 Proof of Reserves
 Decentralized Exchanges
 Funding Rate
 Funding Heatmap
 Liquidation Data
 Max Pain
 Long/Short Ratio
 Whale L/S Ratio
 Binance/Okex/Huobi L/S
 Bitfinex Margin L/S
 ETF Tracker
 Solana ETF
 XRP ETF
 Hong Kong ETF
 Bitcoin Treasuries
 Crypto Reversal
 Ethereum Reserves
 HyperLiquid Wallet Analysis
 Hyperliquid Whale Watch
 Large Transactions
 On-chain Movement
 Bitcoin ROI
 Stablecoin Market Cap
 Options Analysis
 News
 Articles
 Economic Calendar
 Features
 Wallet
 Contract Calculator


 Security
 Collections
 Watchlist
 Following
 BTC
 ETH
Bitcoin price forecast: Analysis of the contradiction between capital inflows and sideways shocks
On Friday evening, October 2, 2026, the Bitcoin trading price was approximately US$84,500 (Data source: CoinMarketCap). This price is almost the same as ten days ago. However, during this period, a large amount of money has poured into the Bitcoin market: the U.S. spot ETF absorbed $2.65 billion in funds in September, and the trend of inflows continued in early October. For the current Bitcoin price forecast, the core contradiction is: Why has the price not increased even when funds continue to buy?
Market dynamics revealed by ETF data
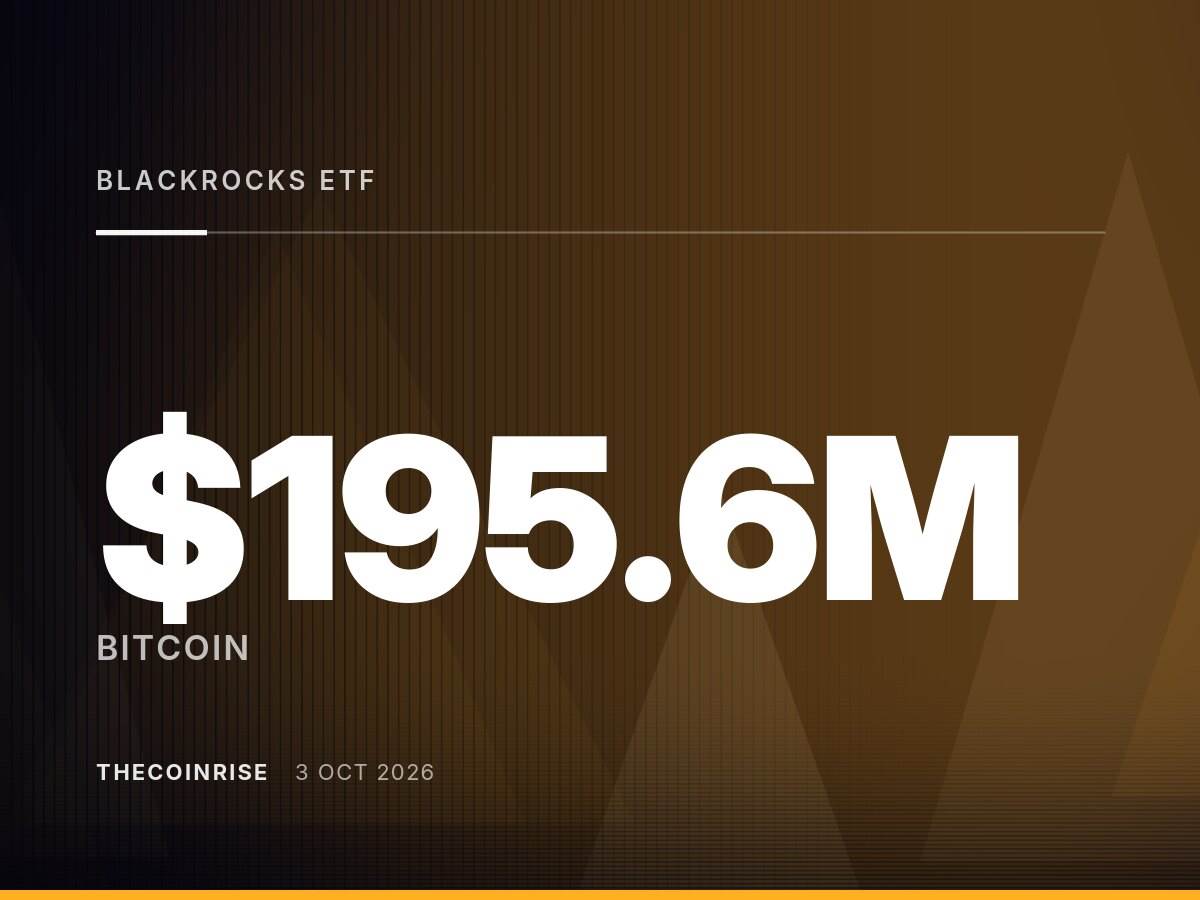
According to SoSoValue, net inflows of US$2.65 billion in September were the second highest monthly record since October 2025; the previous net inflows in August were US$3.52 billion. There was an outflow of $148.7 million on the last trading day of September, but another $102.7 million flowed in on October 1. Currently, the total value of Bitcoin held by these funds is approximately US$109.3 billion (source: Cointelegraph).
From the third quarter, this inflow brought significant returns. From June 30 to September 30, the price of Bitcoin rose from US$58,566 to US$83,576, an increase of nearly 43%(based on daily closing price, data source: CoinMarketCap). However, prices have all but stagnated since September 21.
Key price levels in the chart
The one-year trend chart clearly shows two phenomena: one is the deep correction after hitting a record high in October 2025, and the other is the recovery since summer. Over the past twelve months, the highest daily close has been around $124,700 and the lowest has been around $58,600. Currently, Bitcoin's price is well above our 50-day moving averages (approximately US$78,300) and 200-day moving averages (approximately US$75,300) based on daily closing prices.
Top resistance:
Around US$86,600 is the key upside resistance. Bitcoin closed at US$86,597 on September 21 and has not exceeded that high since then. Prices briefly climbed to around $87,100 on Friday after the U.S. jobs report, but fell below that level overnight. Crypto.news also listed $86,500 as a major obstacle. For a detailed analysis of how the employment report affects price trends, please refer to our relevant feature article.
Lower support:
Around US$83,500 is the key lower support. No daily close has been below this level since September 21; the lowest was on September 28 at $83,479. As a result, the area has been successfully held three times.
Moving average support:
US$78,300 and US$75,300 are the two lower moving averages respectively. If the area near $83,500 falls, there is about 6% downside from the 50-day moving average. Between $81,000 and $83,500, two closing prices on September 19 and 20 could serve as potential buffers.
Why did capital inflows fail to push up prices?
Fund inflows into ETFs are only one side of the market. On the other hand is selling pressure: long-term holders choose to take profits after making a quarterly profit of nearly 43%, or traders close leveraged positions. When buying and selling forces reach an equilibrium, prices tend to remain static. Inflows in September were smaller than in August, confirming this situation: buyers are still there, but their push is not as strong as summer.
Bitcoin and Ethereum: The divergence of institutional investors
In sharp contrast to Ethereum, when the Bitcoin ETF absorbed funds on October 1, the Ethereum ETF flowed out of US$55.4 million, the third consecutive net outflow (Source: Cointelegraph). This suggests that institutional investors were more inclined to Bitcoin at the beginning of the fourth quarter. For the performance comparison of these two largest crypto assets, see our fourth-quarter comparative analysis for details.
For German investors, buying U.S. Bitcoin ETFs is usually not a direct way because such funds are generally not tradeable in Germany. Investors who want to purchase Bitcoin directly can refer to our Bitcoin Savings Plan Comparison article to learn about the various providers and their fees. The fixed investment plan can allocate admission costs to different times, thereby eliminating the problem of timing.
Summary: Three key points
- Demand exists but is limited: Demand for funds does exist, but it is not yet enough to push prices above $86,600.
- Horizontal trading is a break: As long as the area around $83,500 remains solid, the current sideways phase is just a pause after a strong quarterly performance.
- Direction signal: A price close outside the US$83,500 to US$86,600 range will be the next signal to determine the direction of the trend.
Any investor taking profits during the summer should be aware of the shareholding period: In Germany, bitcoins held for less than a year are subject to capital gains tax if they exceed the annual tax exemption of € 1,000 when sold. Whether the current price is worth entering, please refer to our analysis article "Is Bitcoin a good buying opportunity at the current price?"
Cryptocurrencies fluctuate violently and there is a risk of full loss. This article does not constitute advice on buying and selling Bitcoin. (As of October 2, 2026. This article is for reference only and is not investment advice. Price and rate structures are subject to change; please check terms with your provider before purchasing.)