Exchange Ranking
 Top Exchanges
 24h Volume Ranking
 Popularity Ranking
 Exchange BTC Balance
 Proof of Reserves
 Decentralized Exchanges
 Funding Rate
 Funding Heatmap
 Liquidation Data
 Max Pain
 Long/Short Ratio
 Whale L/S Ratio
 Binance/Okex/Huobi L/S
 Bitfinex Margin L/S
 ETF Tracker
 Solana ETF
 XRP ETF
 Hong Kong ETF
 Bitcoin Treasuries
 Crypto Reversal
 Ethereum Reserves
 HyperLiquid Wallet Analysis
 Hyperliquid Whale Watch
 Large Transactions
 On-chain Movement
 Bitcoin ROI
 Stablecoin Market Cap
 Options Analysis
 News
News Articles
 Economic Calendar
 Features
 Wallet
 Contract Calculator


 Security
 Collections
 Watchlist
 Following
 BTC
BTC  ETH
ETH  SHIB
SHIB Shiba Inu Price Forecast
Discussions on price forecasts of Shiba Inu (SHIB) usually begin with a brief review of the token's basic attributes. SHIB was launched in August 2020 as an Ethereum-based Meme Coin and was initially positioned as a community-driven alternative to Dogecoin. Since then, it has developed into one of the most widely held meme tokens on the market and is currently ranked 33rd by market value.
As of press time, the trading price of SHIB was $0.000053, up 2.5% in the past 24 hours. Its market value is approximately US$3.147 billion, and its circulation supply is approximately 589.239 billion tokens.
Shiba Inu Real-time Market Data
Indicator Value Price $0.0000053 24-hour Rise and Fall +2.5% 24-hour Trading Range $0.0000052-$0.0000055 Market Value $3.147 billion fully diluted valuation of $3.149 billion 24-hour trading volume of $74.37 million circulating supply 589.239 billion total supply 589.496 billion Data source: SHIB market value data is taken from CoinGecko, data as of September 4, 2026. Data from different tracking sites may differ slightly.
Shiba Inu Exchange Trading Volume
SHIB's futures trading activity is spread across several mid-sized exchanges rather than concentrated on a single platform. LBank led the way with 24-hour futures volume of $17.31 million, followed by OKX with $15.89 million in volume.
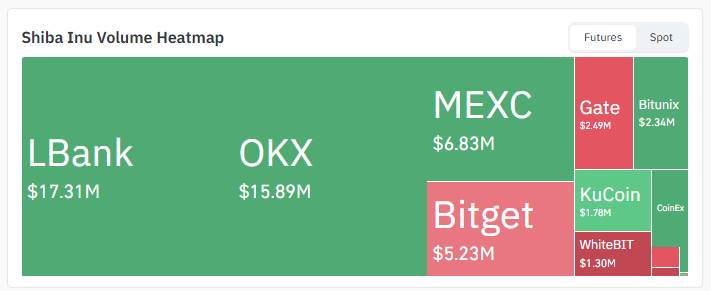 Data source: Trading volume heat map data is taken from CoinGlass, as of September 4, 2026.
Bitget recorded $5.23 million and MEXC at $6.83 million. The contributions of Gate, Bitunix, KuCoin and WhiteBIT were relatively small, with $2.49 million,$2.34 million,$1.78 million and $1.3 million respectively. CoinEx also had a small amount of traffic. This decentralized trading volume model is typical of memes, with retail activity often spread across a wider platform.
Shiba Coin News
According to U.Today (@ today_en):
$SHIB veterans confirmed that Shibarium has been upgraded and launched, and nine contracts have been verified.
Data source: Data from @Utoday_en X account, as of September 4, 2026.
Why it matters:
A well-known Shiba Inu community figure confirmed that the new Shibarium upgrade is now online. The update involves nine verified contracts. Continued development activity on Shibarium is often seen as a sign that the underlying technology of the ecosystem is still progressing, independent of short-term price fluctuations.
According to BSCN (@BSCNews):
Shiba Inu Giant Whale continues to sell its position worth 9 billion US dollars
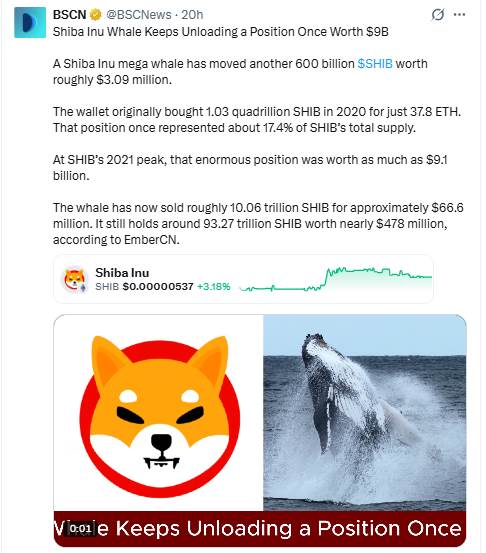 Data Source: Data from @BSCNews X account, as of September 4, 2026.
Why it matters:
A Shiba Inu super whale transferred another 600 billion SHIBs, worth approximately US$3.09 million. The wallet originally purchased 103 trillion SHIBs with only 37.8 ETH in 2020. This position once accounted for approximately 17.4% of SHIB's total supply. When SHIB peaked in 2021, it would be worth US$9.1 billion. According to EmberCN statistics, the giant whale has sold about 10.06 trillion SHIBs, making a profit of about US$66.6 million, and still holds about 93.27 trillion SHIBs, worth nearly US$478 million.
These two development trends show different directions. Shibarium's upgrade points to continued improvement in the ecosystem, while the continued selling of giant whales is a reminder that early large holders still have large quantities of SHIBs for sale.
Shiba Inu Price Forecast Outlook: Technical Analysis
The daily SHIB/USDT chart on Binance shows that prices are moving in an upward channel, with both the upper and lower boundaries of the channel trending upward in the past few weeks.$ SHIB is currently trading near the middle of the channel, a position that makes the next trend unclear.
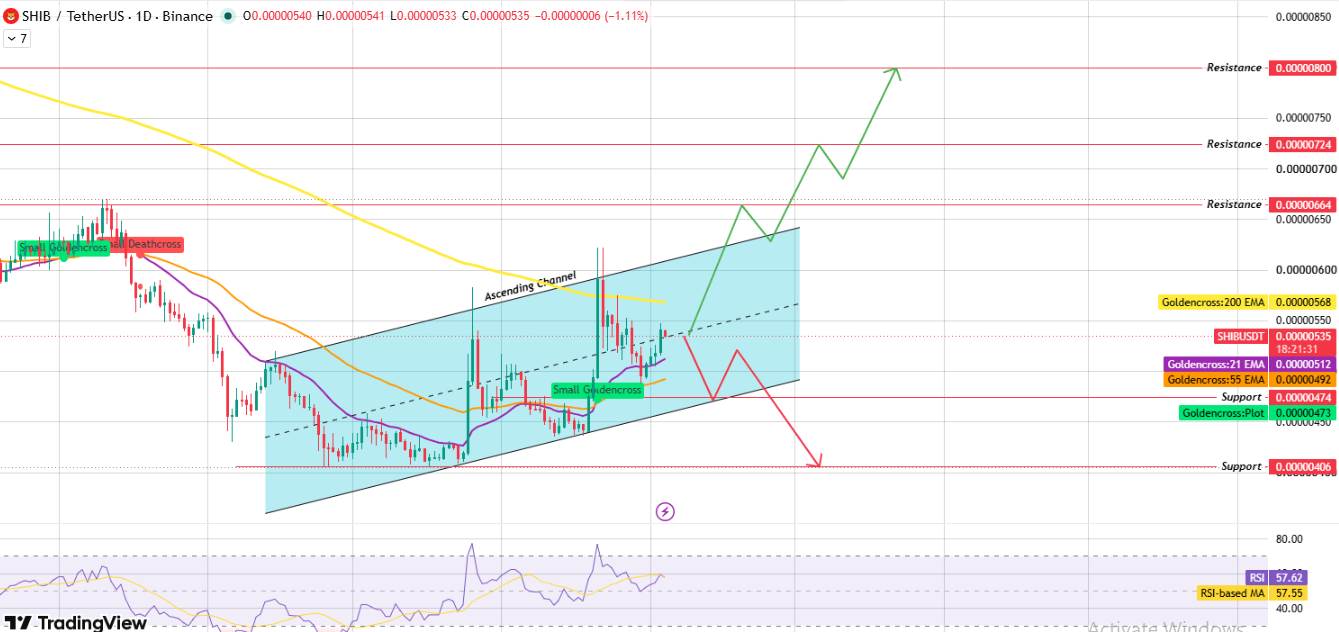 Data source: Chart taken from TradingView, as of September 4, 2026.
Can SHIB break through to the upper edge of the channel?
If prices rebound from the middle of the current channel, the first condition for upward movement is that the daily close is above 200 EMA ($0.0000568). Clearing this level and the upper edge of the channel will open the path to $0.0000664,$0.0000724, and finally $0.0000800.
What happens if SHIB breaks below the lower edge?
If prices fall to the lower edge of the channel and close below, the pattern will turn bearish. This will put the support bit of $0.0000474 into focus, and if you cannot hold it, it may move towards $0.0000406.
The RSI reading was 57.62 and its moving average was 57.55, which was in a fairly neutral region. This leaves room for two-way movement, and there is no immediate overbought or oversold pressure.
Shiba Inu Support and Resistance (Daily Chart)
Type Price Resistance 3 $0.00000800 Resistance 2 $0.0000724 Resistance 1 $0.0000664 Support 1 $0.0000474 Support 2 $0.0000406 Shiba Inu EMA Level (Daily Chart)
EMA Numeric Price Position 21 EMA $0.00000512 Price above 55 EMA $0.0000492 Price above 200 EMA $0.00000568 Price Below Shiba Inu Price Forecast: Bull Market, Benchmark and Bear Market Scenarios
Scenarios set targets The bull market scenario rebounded from the middle of the channel, with the daily closing above 200 EMA and the upper edge of the channel at $0.000066, extended targets at $0.000072 and $0.000080 The benchmark scenario price continued to move between the upper and lower boundaries of the rising channel. The range trading bear market scenario within the channel fell to the lower edge of the channel, and then the daily closing below that level at $0.000047. Deep breaks look at $0.000041 Glossary
Ascending Channel: A chart pattern formed by two parallel upward sloping trend lines, prices tend to fluctuate between upper and lower limits as the overall trend continues to move higher.
EMA (Exponential Moving Average): A moving average that gives more weight to recent price data, making it respond more quickly to new price behavior than a simple average.
Golden Cross: The pattern of the short-term moving average crossing the long-term moving average is usually regarded as an early signal of the accumulation of upward momentum.
RSI (Relative Strength Index): A momentum indicator score between 0 and 100 that reflects the speed and magnitude of recent price movements and is often used to identify overbought or oversold conditions.
Whale Wallet: A crypto wallet that holds an unusually large number of specific tokens whose buying and selling activity is sufficient to affect market sentiment or, in a less liquid market, the price itself.
Support Zone: Buying interest had been strong enough to slow or reverse the falling price area.
Resistance Zone: Selling pressure was strong enough to slow or reverse the rising price area.
Shiba Inu Coin vs. Bitcoin
In the past few trading days, the price trend of SHIB has largely been synchronized with Bitcoin, which is consistent with the typical performance of memoin in the overall market trend. Bitcoin is trading at close to $81,000 today, and as the dominant asset in the market, its direction often sets the tone for high-risk tokens like SHIB. If Bitcoin prices remain in a stable or rising environment, it may support SHIB's attempt to break through the upper edge of its rising channel. If Bitcoin turns lower, no matter how Shibarium's own development progresses, SHIB's mid-channel position could easily give way to the bearish scenario mentioned above.
Expert opinion
Comments surrounding Shibarium are increasingly divided into two main lines: the stable technological development of Shibarium and the continued sell-off by some of the earliest holders of the tokens. Analysts focusing on the memin space point out that continued contract verification and upgrade activity suggests that the project technical team remains active, although large legacy wallets are still reducing their positions. Price movements in the short term are expected to depend on whether SHIB can break through its 200 EMA and the upper edge of the current rising channel on the daily chart.