Exchange Ranking
 Top Exchanges
 24h Volume Ranking
 Popularity Ranking
 Exchange BTC Balance
 Proof of Reserves
 Decentralized Exchanges
 Funding Rate
 Funding Heatmap
 Liquidation Data
 Max Pain
 Long/Short Ratio
 Whale L/S Ratio
 Binance/Okex/Huobi L/S
 Bitfinex Margin L/S
 ETF Tracker
 Solana ETF
 XRP ETF
 Hong Kong ETF
 Bitcoin Treasuries
 Crypto Reversal
 Ethereum Reserves
 HyperLiquid Wallet Analysis
 Hyperliquid Whale Watch
 Large Transactions
 On-chain Movement
 Bitcoin ROI
 Stablecoin Market Cap
 Options Analysis
 News
News Articles
 Economic Calendar
 Features
 Wallet
 Contract Calculator


 Security
 Collections
 Watchlist
 Following
 ETH
ETH Core Points
- Sharp reversal in ETF funds flows
- Bear traders encounter a wave of liquidations
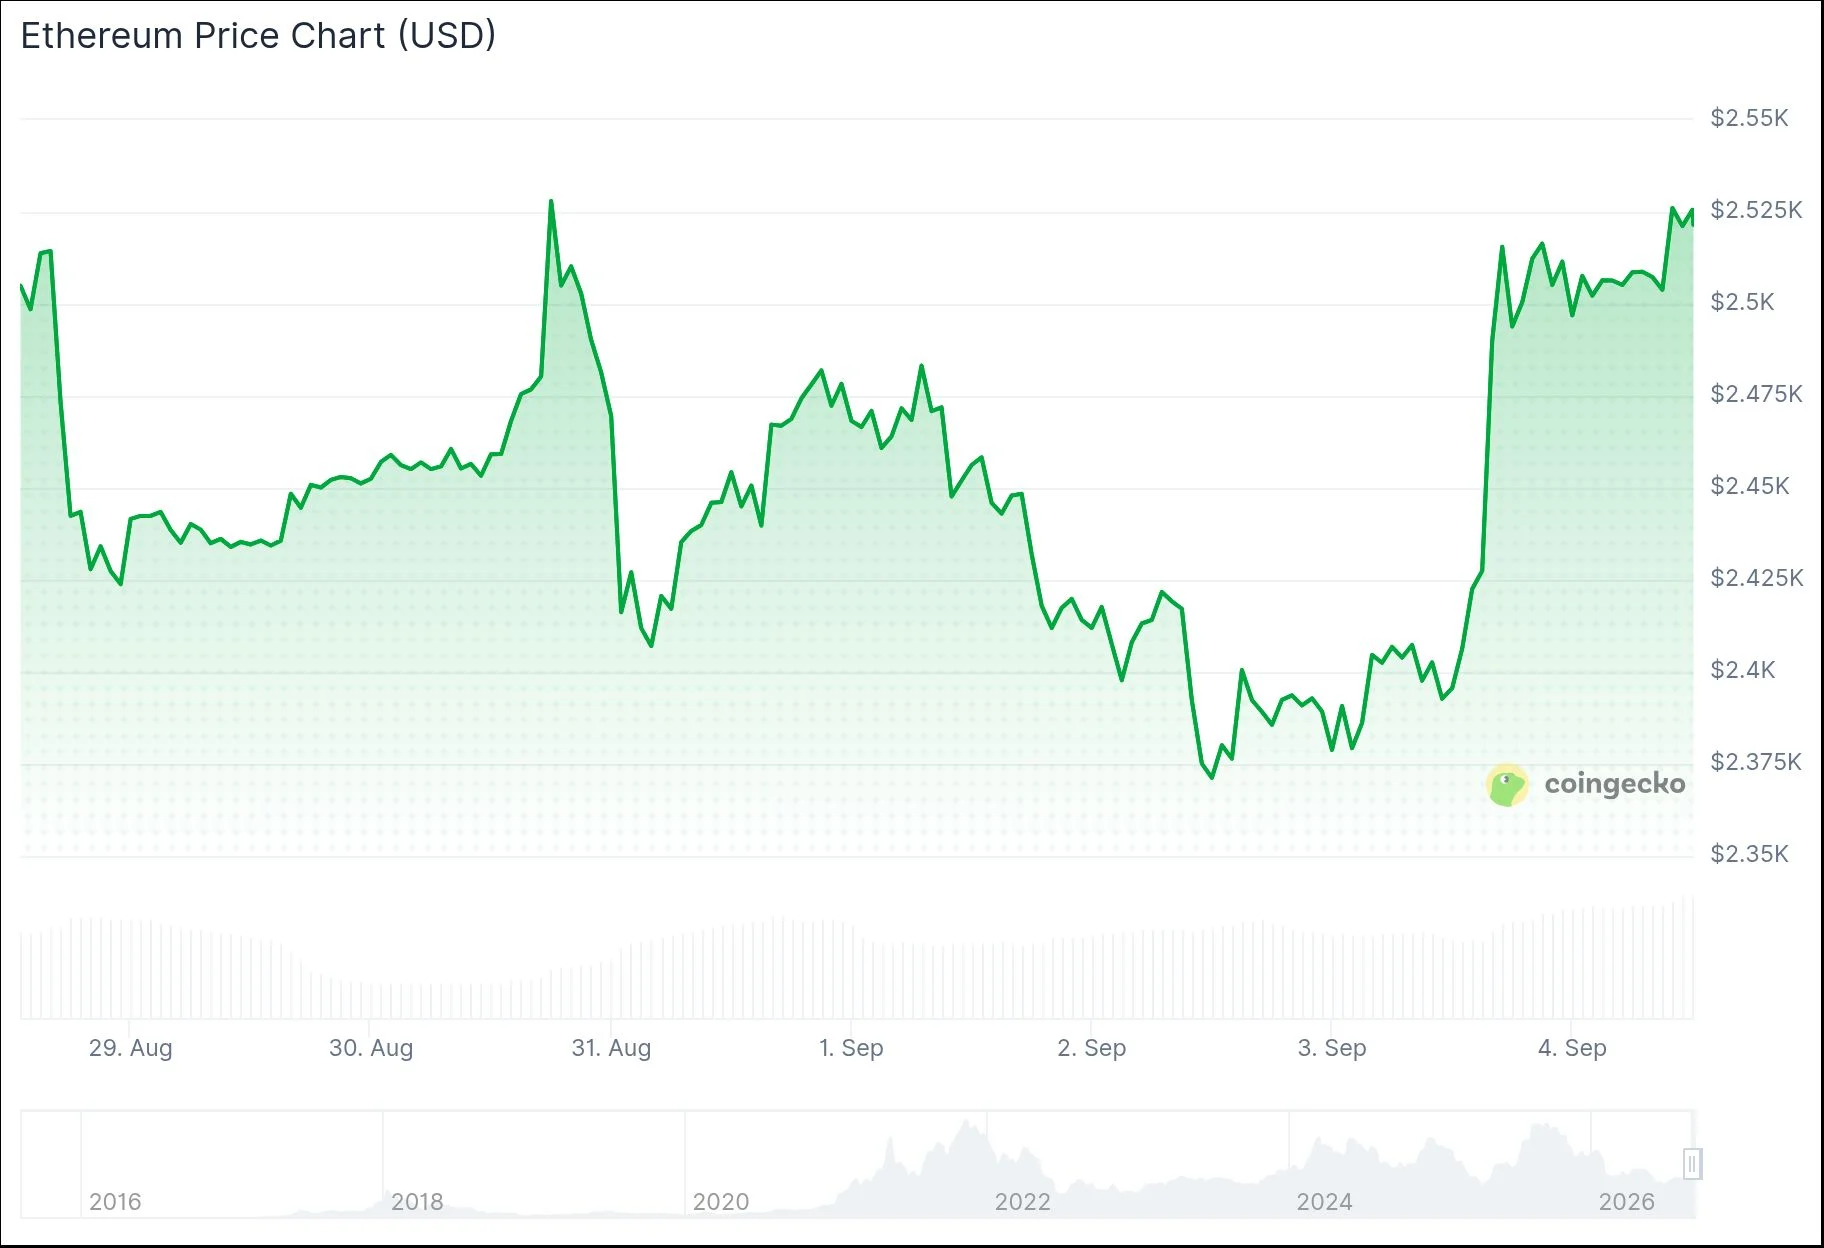
Ethereum (ETH) rose about 5% on Thursday to climb to $2,508, approaching the key $2,560 resistance level. On September 3, the U.S. spot Ethereum ETF recorded a net inflow of US$141.39 million, in sharp contrast to the previous day's outflow of US$48 million. Within 24 hours, short positions suffered a liquidation of $82.41 million, far exceeding the loss of $20.76 million on long positions. The price rise stems from broader market catalysts-weakening concerns about a conflict in Iran and reduced market expectations for a Fed rate hike. Ethereum remained above the moving averages of all four major exponential, with an initial target set at $2,560, followed by $2,600.
Ethereum recorded a significant 5% gain on Thursday, September 4, pushing prices towards $2,508. The breakthrough followed a lengthy consolidation period in which price movements were limited to support at $2,400 and resistance at $2,560.
Ethereum (ETH) price trend
This upward momentum is not related to specific developments in Ethereum, but is influenced by two broader macroeconomic catalysts. At first, emerging reports suggested a possible downgrade of tensions between the United States and Iran eased risk aversion across financial markets. In addition, Fed Governor Christopher Waller downplayed speculation of a September rate hike, saying: "Give inflation time and we can wait for another meeting."
Disappointing employment data further strengthened this dovish outlook. The ADP report showed that U.S. private-sector employers added only 38,000 jobs in August, down from an expected 47,000 and posting their weakest performance since January. The market's implicit probability of a September rate hike plunged from 70% to 50%.
Market analyst Ted Pillows (@TedPillows) pointed out on Platform X that Ethereum encountered selling pressure after hitting resistance at $2,550. He suggested that if the weekly closing price exceeds $2,550, it may catalyze a move towards the $3,000 mark.
$ETH once again hit the US$2,550 resistance level and was rejected.
If Ethereum can close above the $2,550 level every week, it could quickly rebound back to $3,000.
ETF capital flows have reversed sharply
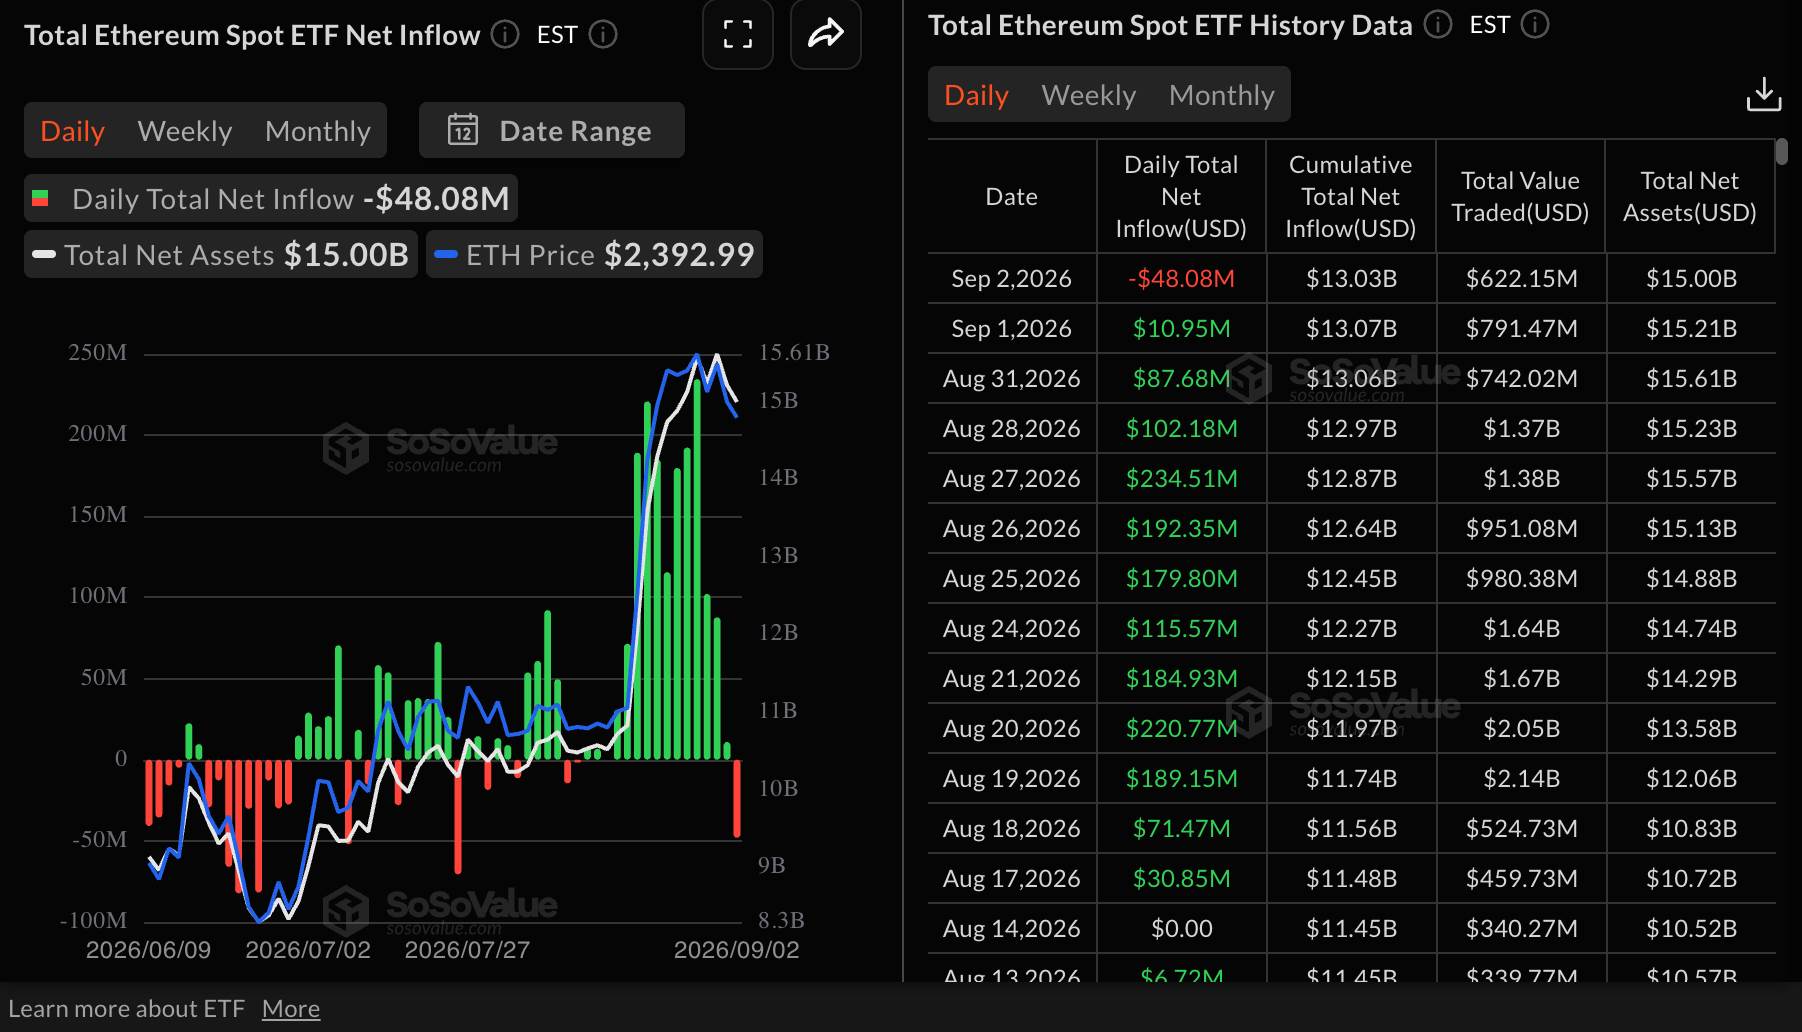
After the withdrawal of US$48.08 million on September 2, the spot Ethereum ETF product has experienced a major turning point. On September 3, total net inflows reached US$141.39 million. BlackRock's ETHA products dominated with $72.07 million in new capital, while Fidelity's FETH contributed $65.11 million. Gray's ETHE continued to lose assets, with a net outflow of US$6.07 million. Cumulative inflows of all Ethereum exchange-traded products have reached US$13.17 billion.
The correlation between ETF activity and spot market performance remained close on both trading days, with price movements almost perfectly reflecting fund flow patterns, whether during declines or subsequent recovery.
Bear traders encounter a wave of liquidations
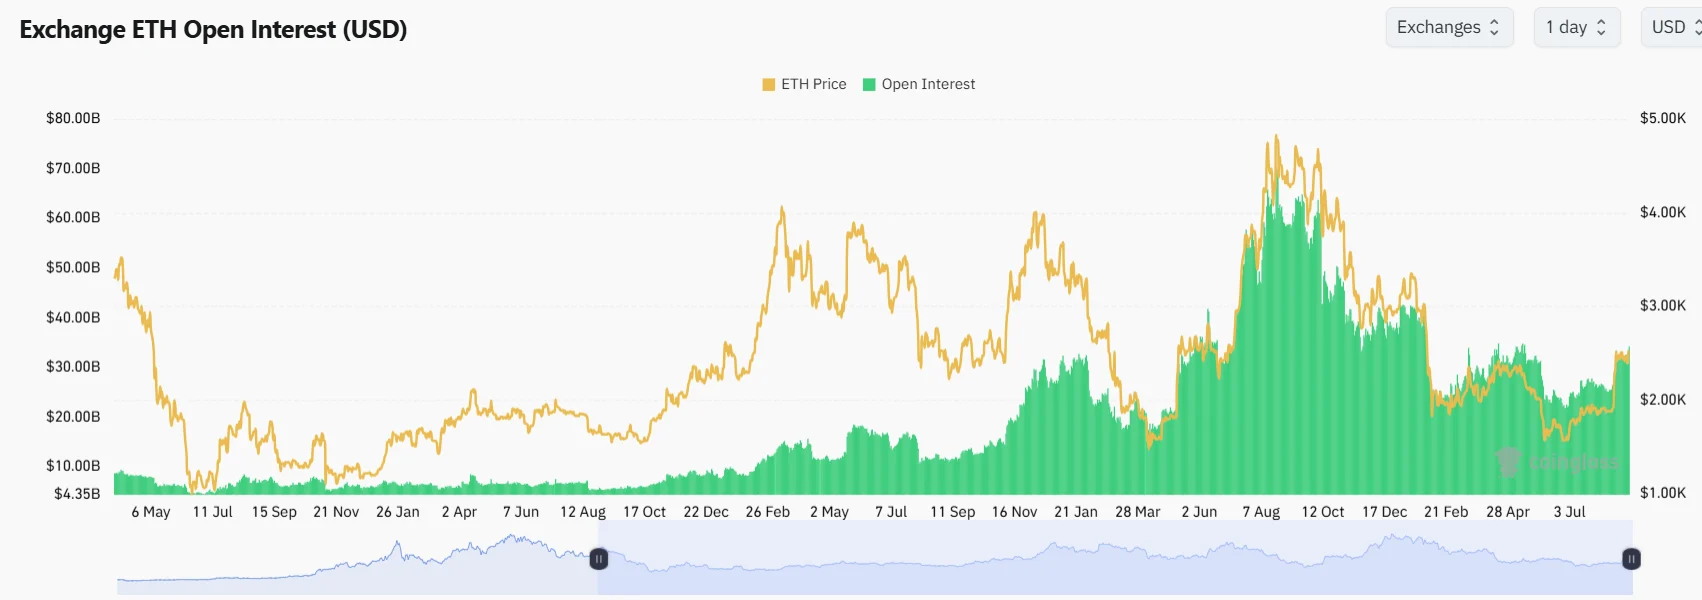
During the 24-hour period, trading volume on ETH derivatives contracts expanded by 17.84% to US$57.18 billion. Open interest increased 5.36% to US$34.13 billion. The total liquidation of short positions was US$82.41 million, while long positions were only US$20.76 million-evidence of aggressive short-selling.
However, the latest hourly data shows a change in dynamics. Long positions suffered a liquidation of $193,090, while short positions were only $33,200, indicating increased two-way volatility rather than continued directional momentum.
Ethereum currently trades above the moving averages of all four key indices. The 20-cycle EMA is at $2,455.94, the 50-cycle EMA is at $2,438.36, the 100-cycle EMA is at $2,363.41, and the 200-cycle EMA is at $2,222.64. The upper boundary near $2,560 has repeatedly prevented upward attempts since August 27, including a brief surge to $2,555 on August 28 and then quickly reversed.
On September 3, ETF inflows decisively reversed to US$141.39 million, pushing the cumulative traffic of all Ethereum investment vehicles listed in the United States to US$13.17 billion.