Exchange Ranking
 Top Exchanges
 24h Volume Ranking
 Popularity Ranking
 Exchange BTC Balance
 Proof of Reserves
 Decentralized Exchanges
 Funding Rate
 Funding Heatmap
 Liquidation Data
 Max Pain
 Long/Short Ratio
 Whale L/S Ratio
 Binance/Okex/Huobi L/S
 Bitfinex Margin L/S
 ETF Tracker
 Solana ETF
 XRP ETF
 Hong Kong ETF
 Bitcoin Treasuries
 Crypto Reversal
 Ethereum Reserves
 HyperLiquid Wallet Analysis
 Hyperliquid Whale Watch
 Large Transactions
 On-chain Movement
 Bitcoin ROI
 Stablecoin Market Cap
 Options Analysis
 News
News Articles
 Economic Calendar
 Features
 Wallet
 Contract Calculator


 Security
 Collections
 Watchlist
 Following
 PENGU
PENGU  PEPE
PEPE PENGU continues to be under pressure below the long-term downtrend line, and PEPE falls into range fluctuations.
PENGU is experiencing a trend of continuous decline in highs and continuous decline in lows over the past few months, and is currently in a long-term downtrend line. Under the suppression. If the daily closing price continues to stand above the resistance level, it may change the current structure; otherwise, if it encounters resistance again, the established downward trend will continue. At the same time, PEPE is still operating within the range, with buyers holding on to support and sellers continuing to suppress the gains near the resistance zone.
After months of consolidation, PENGU is approaching a key technical resistance level, while PEPE is still limited between clear intraday support and resistance levels.
PENGU approaches long-term resistance level
Recent analysis by ZayK Charts pointed out that PENGU seems to have the conditions for a breakthrough. This observation focuses on daily charts and downtrend lines. This trend line has suppressed rebound attempts many times in the overall downtrend. 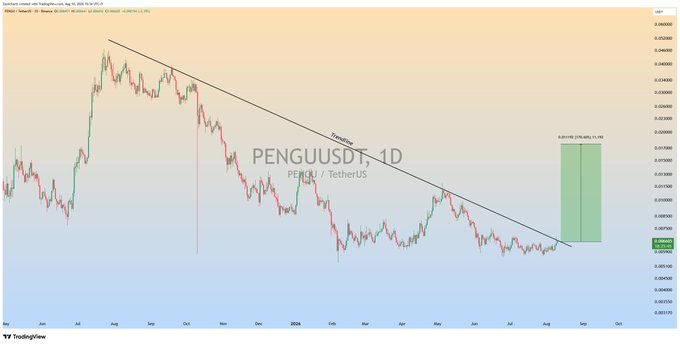
Source: ZAYK Charts
The chart shows that there was a strong pull-up in the middle of last year. The bears then established a series of movements with lower highs and lower lows. These market reactions gradually formed a line of downward resistance that had been clearly visible for months.
Recent candle charts show that price volatility has narrowed within the lower trading range. Compared with the previous decline period, selling pressure has also weakened. At the same time, repeated consolidation attempts show that buyers are still in the low area and continue to defend support.
The rebound in May provided an important reference for the current trend. At that time, PENGU pulled up sharply, hit the downtrend line and then reversed downward. However, the subsequent decline did not show the strength of the previous sell-off.
Breakthroughs confirm or change the current structure
The downtrend line remains the main resistance level facing PENGU. Multiple market reactions in history have strengthened the technical importance of this threshold. If the daily closing price can continue to stand firm above the line, it will provide a stronger breakthrough confirmation signal.
The chart shows that there is a green projection area above the current trading area. This area represents a potential path after a confirmed breakthrough of resistance levels. However, this projection is still a technical goal and is not an inevitable point.
A brief breakthrough gain can only provide a weak confirmation signal, and bears still have the potential to drag prices back below the trend line. Therefore, continuing to operate above the resistance level is more reference value than isolated pin breakthroughs.
If there is another blockage at the trend line, the overall bearish structure will continue. Prices may then fall back into the established consolidation area. Therefore, the next daily candle chart will determine whether the current compressed pattern will evolve into a trend expansion.
PEPE remains within a narrow range.
PEPE shows a short-term structure with clear boundaries. The chart shows that its current price is approximately US$0.000052879. The token rose 0.57% in 24 hours, and transaction volume increased by more than 50%. 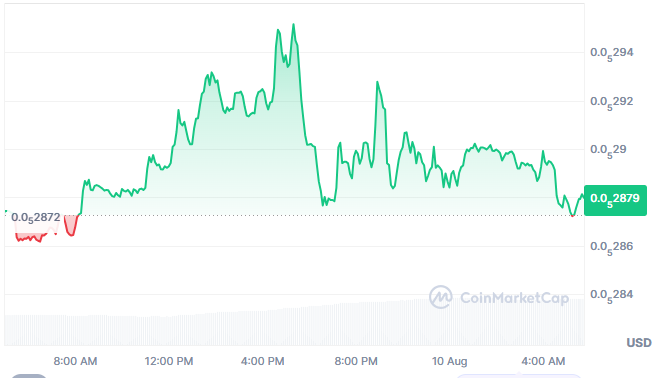
Source: Coinmarketcap
Prices initially started rising from the approximately US$0.00005286-US$0.00005287 region. The buyer then pushed the price to the range of $0.00005294-$0.00005295. But selling immediately suppressed the rally and pulled prices back into lower range.
The current resistance zone lies between US$0.00005292 and US$0.000005295. Many tests failed to achieve effective breakthroughs. At the same time, support remains concentrated in the range of US$0.00005287-US$0.00005288.
If the resistance level can be exceeded, it will strengthen the short-term bullish structure of PEPE. On the contrary, if support is lost, it will weaken the current rebound momentum and expose a lower price level. As a result, both tokens currently face clearly defined technical decision points.