Exchange Ranking
 Top Exchanges
 24h Volume Ranking
 Popularity Ranking
 Exchange BTC Balance
 Proof of Reserves
 Decentralized Exchanges
 Funding Rate
 Funding Heatmap
 Liquidation Data
 Max Pain
 Long/Short Ratio
 Whale L/S Ratio
 Binance/Okex/Huobi L/S
 Bitfinex Margin L/S
 ETF Tracker
 Solana ETF
 XRP ETF
 Hong Kong ETF
 Bitcoin Treasuries
 Crypto Reversal
 Ethereum Reserves
 HyperLiquid Wallet Analysis
 Hyperliquid Whale Watch
 Large Transactions
 On-chain Movement
 Bitcoin ROI
 Stablecoin Market Cap
 Options Analysis
 News
News Articles
 Economic Calendar
 Features
 Wallet
 Contract Calculator


 Security
 Collections
 Watchlist
 Following
 DOGE
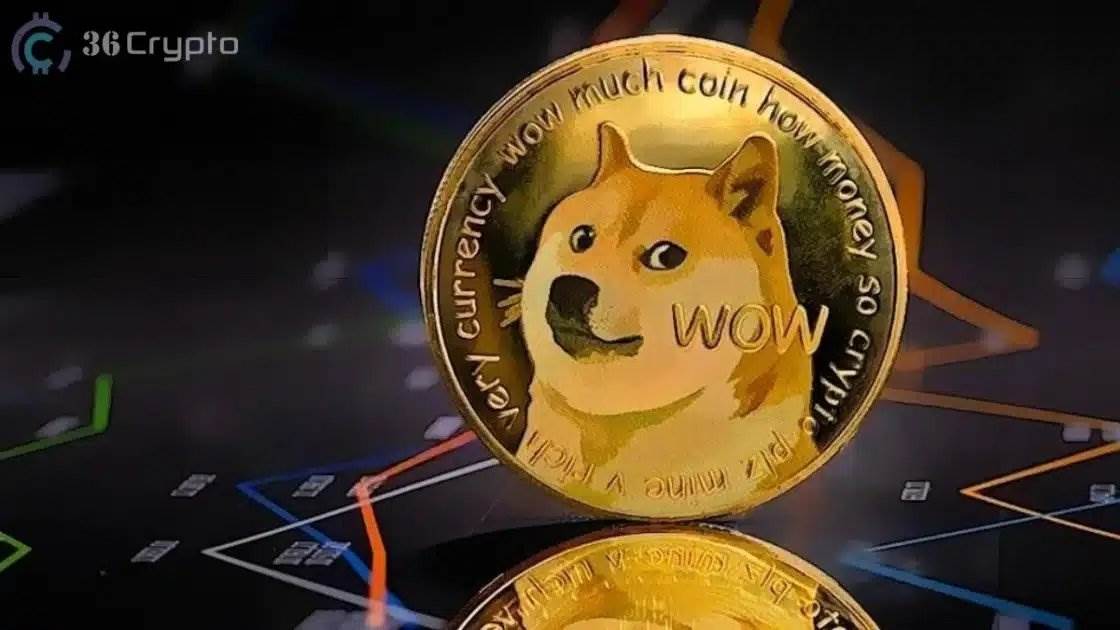
DOGE The prospects of Dogecoin have led to speculation, and the market is waiting for direction choice.
After a significant increase, the price of Dogecoin has fallen into a narrow range of shocks, re-attracting the attention of market participants. The bullish flag pattern appearing on the hourly chart suggests that a new round of volatility may be ushered in the short term. Cryptocurrency analyst Ali Martinez pointed out that if this pattern is confirmed, the price of Dogecoin may increase by about 30%.
Key prices need to be paid attention to
The current trading of dogcoin is in the range of US$0.087 to US$0.088, and its future trend is at a critical juncture. Martinez believes that to achieve an upward trend, the hourly closing price needs to break through the resistance level of $0.090. Once a breakthrough is made, the pattern will be activated, with an initial target pointing at $0.115-based on current levels, which means a potential increase of about 30%.
Ali Martinez said: "If the hourly closing price is above $0.090, a bullish flag can be confirmed, paving the way for a rise to $0.115."
On the downside, the loss of the US$0.081 support level is crucial. If this level is broken below, the effectiveness of the bullish flag will weaken, sellers may regain dominance, and prices may fall further back to the US$0.056 to US$0.060 range and continue the broader downtrend channel.
What role does trading volume play?
There is strong on-chain accumulation around US$0.081, which becomes a key technical factor in preventing a deep correction. About 30 billion DOGEs had previously changed hands in the region, forming a solid support area that may provide stability during local pullbacks.
About 30 billion DOGE units had previously traded around $0.081, making it a strong support area against potential downturns.
Despite the short-term bullish pattern, resistance pressure has not completely dissipated over the longer cycle. The flag-shaped shape observed on the hourly chart actually formed inside a larger descending wedge on the daily chart. Dogecoin recently tried to break the psychological barrier of US$0.10, but encountered resistance at the 200-day index moving average around US$0.095.
Breakthrough US$0.090 or push the price to US$0.115.
A loss of US$0.081 may signal a price drop to US$0.056 to US$0.060.
Support around US$0.081 was strengthened by a large number of historical transactions.
Trading volume at the end of August will be an important determinant. If buying strengthens, it may catalyze an upward breakthrough. Otherwise, Dogecoin may continue to conduct long-term sideways consolidation within the current range.