Exchange Ranking
 Top Exchanges
 24h Volume Ranking
 Popularity Ranking
 Exchange BTC Balance
 Proof of Reserves
 Decentralized Exchanges
 Funding Rate
 Funding Heatmap
 Liquidation Data
 Max Pain
 Long/Short Ratio
 Whale L/S Ratio
 Binance/Okex/Huobi L/S
 Bitfinex Margin L/S
 ETF Tracker
 Solana ETF
 XRP ETF
 Hong Kong ETF
 Bitcoin Treasuries
 Crypto Reversal
 Ethereum Reserves
 HyperLiquid Wallet Analysis
 Hyperliquid Whale Watch
 Large Transactions
 On-chain Movement
 Bitcoin ROI
 Stablecoin Market Cap
 Options Analysis
 News
News Articles
 Economic Calendar
 Features
 Wallet
 Contract Calculator


 Security
 Collections
 Watchlist
 Following
 SOL
SOL  XRP
XRP XRP prices remain in the range of US$1.38 - 1.40, and the technical structure has not yet been decisively broken.
XRP prices fell slightly by about 1%-1.5% today, and the trading range is around US$1.38 - 1.40. The trend continued its relatively calm trading period after a strong rebound in August. While the lack of immediate upward momentum may frustrate bulls, there has yet to be a decisive downward break on the technical front.
Currently, the two analysts are closely monitoring potential breakthroughs. Bird believes that as long as the channel structure remains intact, XRP remains in a "bullish flag" pattern that favors further gains. At the same time, Ali Martinez identified a shorter-term trigger: If the hourly chart closes firmly above $1.40, he believes it will push the XRP towards $1.46.
Taken together, the chart shows that XRP is in an interesting position. Prices are in the middle of a wider consolidation range and are increasingly approaching key levels that may determine their next move.
The XRP bullish flag pattern remains intact
Bird's four-hour chart began with a strong rally in mid-August, when XRP surged from about $1 to a peak of $1.70. Subsequently, XRP did not continue vertically upward, but entered a downstream channel. The chart shows that the upper and lower boundaries of the channel are gradually moving downward, and prices fluctuate repeatedly between the two.
Bird interprets this structure as a "bullish flag". This judgment is crucial because bullish flags usually form after strong upward impulses. The initial pull-up constituted a flagpole, while the subsequent downward or horizontal consolidation allowed the market to absorb previous gains and accumulate strength for the next round of potential upside.
In the case of XRP, the flagpole part is very obvious. The price soared from about $1 to $1.70 in just a few days, before entering the current channel. What happens after that is equally important.
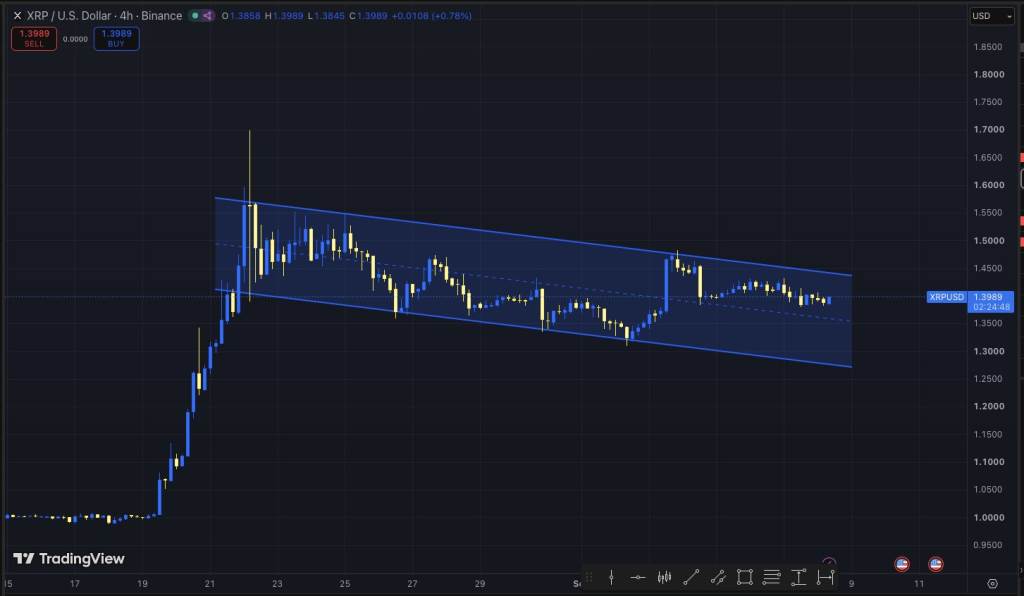
Despite repeated sell-offs, XRP did not effectively fall below the lower boundary of the channel drawn by Bird. Prices fell back to around $1.31-$1.33 in early September, but then rebounded strongly to $1.47. This recovery shows that buyers are still willing to step in at the bottom of the structure. Since then, XRP prices have returned to around $1.40, leaving it roughly in the middle of the channel.
What circumstances will confirm a breakthrough of the XRP bullish flag?
The most critical part of the Bird chart is the upper boundary. In the current pattern, this downward resistance level is around $1.43-$1.45. XRP recently tested approximately $1.46-$1.48, but failed to effectively stand on the channel. This means that a bullish breakthrough has not yet been confirmed.
A strong breakthrough in the area of approximately US$1.44 - 1.45 would allow XRP to cross the upper border and provide stronger evidence that the consolidation is coming to an end. Subsequently, the chart shows that the recent $1.47 - 1.50 area will become a direct obstacle. On top of that, August price movements showed another important area, namely $1.55-$1.60.
The other side of the setups is equally important.
XRP Breakthrough Observation
The lower boundary of the Bird channel is currently approximately US$1.27-US$1.30 and is still slowly moving downward. As a result, XRP still has downside space while still technically within the structure. That's exactly why Bird said traders don't have to be worried just because XRP falls within the channel.
However, if the lower boundary is effectively broken, the situation will be completely different. By then, the judgment of maintaining a "complete bullish flag" will become difficult to defend.
Ali Martinez keeps a close eye on $1.40 to capture faster breakthroughs
Ali Martinez focuses on a much shorter time frame. According to Martinez's analysis, the XRP price seems to form a downward triangle on the hourly chart. He is watching whether the hourly chart closes firmly at $1.40. If that happens, his target price is about $1.46. His analysis was reported along with XRP trading around $1.39 today.
When combined with Bird's four-hour chart, this creates an interesting sequence. $1.40 is the first trigger point. If XRP closes firm here and Martinez's pattern unfolds, the price could move towards $1.46.
But around US$1.43-US$1.46 is also the area where Bird's larger bullish flag resistance is starting to play a significant role. In other words, Martinez's $1.46 target could push XRP directly into areas where a more meaningful four-hour breakthrough is needed.
This makes the next few key levels relatively clear. XRP first needed to vigorously recover $1.40 and then attacked the approximately $1.43 - 1.46 area. If buyers are able to push prices across the region, the logic of a larger bullish flag will become even more compelling.