Exchange Ranking
 Top Exchanges
 24h Volume Ranking
 Popularity Ranking
 Exchange BTC Balance
 Proof of Reserves
 Decentralized Exchanges
 Funding Rate
 Funding Heatmap
 Liquidation Data
 Max Pain
 Long/Short Ratio
 Whale L/S Ratio
 Binance/Okex/Huobi L/S
 Bitfinex Margin L/S
 ETF Tracker
 Solana ETF
 XRP ETF
 Hong Kong ETF
 Bitcoin Treasuries
 Crypto Reversal
 Ethereum Reserves
 HyperLiquid Wallet Analysis
 Hyperliquid Whale Watch
 Large Transactions
 On-chain Movement
 Bitcoin ROI
 Stablecoin Market Cap
 Options Analysis
 News
 Articles
 Economic Calendar
 Features
 Wallet
 Contract Calculator


 Security
 Collections
 Watchlist
 Following
 PUMP
PUMP breaks through long-term resistance zone, and weekly structure shifts to potential breakthrough stage.
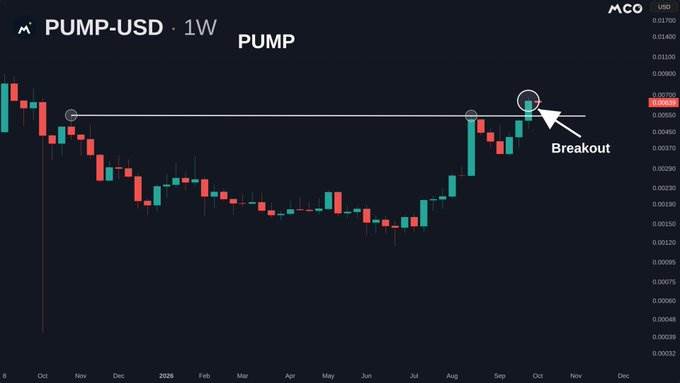
After months of recovery, PUMP has cleared long-term resistance zone and its weekly structure is shifting to potential breakthrough stage. The token rebounded strongly from intraday lows, but sellers remained active near the latest upper trading range and resistance levels. If the previous resistance level can be held, it will support a breakthrough; if it falls below US$0.00640, it may quickly reopen a lower intraday support range.
After months of recovery, PUMP is testing major technology transition nodes. Although weekly resistance levels have been broken, short-term trading is still fluctuating between nearby support and resistance levels today. The weekly structure has exceeded resistance levels, which cryptocurrency media More Crypto Online previously described as breaking through resistance. Weekly charts show months of compression before the latest gains. Prices are currently above a hurdle that has previously resisted a rebound many times.
 Source:X
Broad declines have led to repeated lows on the weekly chart. This weakness eventually moderated in the area below $0.001. A smaller K-line was subsequently formed, building a long bottom in mid-2026. As higher lows hit the summer, the recovery gained momentum. As buyers push prices toward resistance, the rising K-line gradually widens. The action accelerated during July and August.
This significant obstacle has affected price movements in previous rallies. Sellers had previously forced prices down after reaching the same area. Therefore, this return is of greater technical importance.
Breakthroughs need to be confirmed above the obstacle
The latest weekly K-line has broken through the established horizontal resistance. The chart shown places the breakthrough at around $0.00639. This action transforms the structure from resistance testing to potential support. However, weekly charts do not yet show long-term trading above resistance. This makes breakthroughs dependent on continuing to accept prices above the former ceiling. A further weekly K-line will show whether buyers can defend the recovered area.
https://cryptonewsland.com/wp-content/uploads/2026/04/EliteFXLabsBanner-0.webp
A successful step back can turn front resistance into support. This will preserve the series of high rises formed during the recovery. It will also keep the broader breakthrough structure technically intact.
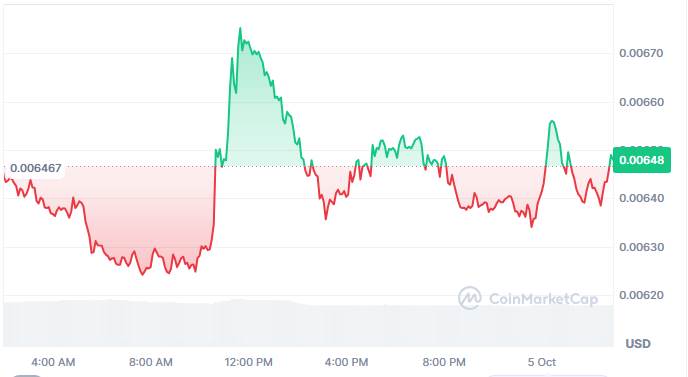
The current intra-day chart shows another battle around nearby levels. The latest reading showed PUMP approaching $0.006459, up 0.88% in 24 hours. The market value is approximately US$2.99 billion, and the trading volume is approximately US$338 million.
Intra-day level definition Next test
Trading started around $0.00647, and then sellers lowered the price. The early decline reached about $0.00622. This action established an intraday low, and then the buyer returned.
 Source:Coinglass
买盘在中午左右加速,推动价格突破0.00640美元。反弹继续上行至0.00660美元以上,随后达到约0.00670美元。卖方在那里做出反应,产生了明显的向下反转。价格后来稳定在0.00640美元附近并横向移动。几次反弹达到约0.00650美元,随后卖方再次介入。这在此前的波动性之后形成了一个更窄的范围。
最新数据显示,尽管日线上涨,但成交量下降了7.98%。流通供应量列为约4643.3亿枚代币。最大供应量为一万亿枚代币。
0.00640美元区域在最近交易中反复吸引买家。与此同时,0.00650美元至0.00656美元区域持续吸引卖家。若持续突破0.00656美元,将加强短期复苏结构。