Exchange Ranking
 Top Exchanges
 24h Volume Ranking
 Popularity Ranking
 Exchange BTC Balance
 Proof of Reserves
 Decentralized Exchanges
 Funding Rate
 Funding Heatmap
 Liquidation Data
 Max Pain
 Long/Short Ratio
 Whale L/S Ratio
 Binance/Okex/Huobi L/S
 Bitfinex Margin L/S
 ETF Tracker
 Solana ETF
 XRP ETF
 Hong Kong ETF
 Bitcoin Treasuries
 Crypto Reversal
 Ethereum Reserves
 HyperLiquid Wallet Analysis
 Hyperliquid Whale Watch
 Large Transactions
 On-chain Movement
 Bitcoin ROI
 Stablecoin Market Cap
 Options Analysis
 News
 Articles
 Economic Calendar
 Features
 Wallet
 Contract Calculator


 Security
 Collections
 Watchlist
 Following
 SOL
Solana 今日新闻:65% 的代币化股票交易量激增能否持续?
如果你关注 Solana 今日的新闻,有一个数字格外引人注目。SolanaFloor 表示,该网络昨日占据了代币化股票交易量的 65%,这一比例比所有其他网络的总和高出 85%。
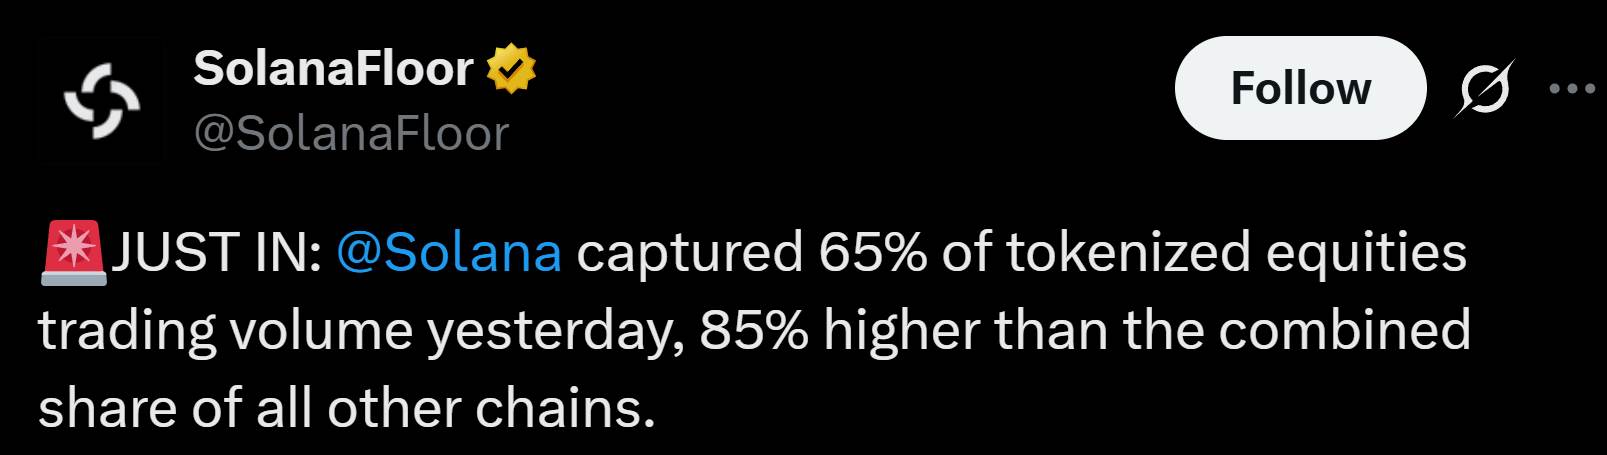 来源:X 平台上的 SolanaFloor
代币化股票是加密货币领域增长最快的细分市场之一,而争夺托管权的竞争也日益激烈。下文我们将解释这一数字的含义、自 7 月以来的走势变化、图表未涵盖的细节,以及 SOL 本身的市场交易情况。
新闻内容及其含义
想象一下公司的股份,就像你可以通过券商购买的股票一样,但以数字代币的形式复制,并在加密网络上而非证券交易所进行交易。这就是代币化股票。
交易量(Trading volume) simply 指交易的总金额。
同一帖子指出,在 2026 年 10 月 10 日,该网络占据了 65% 的交易份额,其分享的 Blockworks 图表也显示了相同的分割比例。用通俗的话来说,每 100 美元的交易中,约有 65 美元流经该网络,其余 35 美元流经所有其他网络。数学计算与帖子相符,因为 65 几乎是 35 的两倍。
Details value/date October 10, 2026 This network's share 65% All other networks 35% Data source Blockworks Solana's share changes since July
Readers of Solana News should know that this is not a steady increase. The chart shows huge fluctuations.
These numbers are read from the chart with the naked eye, so consider them approximations:
The approximate share of the period was above 90% in mid-July, fell to about 20% in late July, and then rebounded to nearly 80% in early August, about 70% in late August, and slipped below 40%. Then below 10% early September low was close to 3% mid-September to early October about 25% to 37% October 10 65% In the days leading up to October 10, the share was around 35%, so this jump is one of the most dramatic one-day changes on the chart.
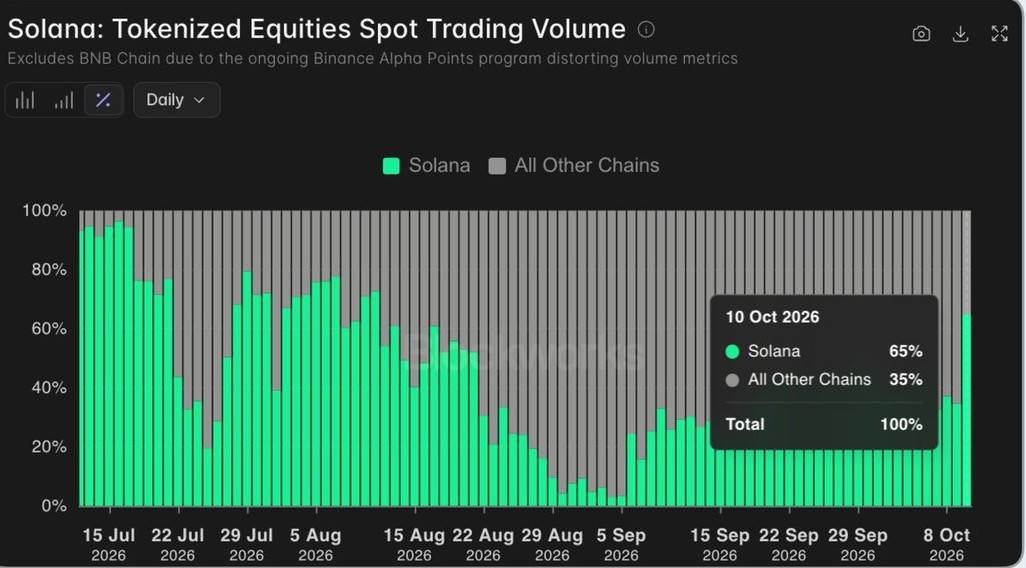 This also brought the share back to the level seen in August.
Considerations behind 65%
A big number deserves careful review. Here are what the chart illustrates and what is not illustrated:
A network is missing. A note to the chart itself states that it excludes BNB Chain because the continued Binance Alpha Points reward program distorts its transaction volume data. Therefore, 65% refers to the share of the counted networks, not the share of all networks.
This is share, not size. The increase in share may be because the network becomes busier, or it may be because other networks are slowing down. The chart cannot tell us what the situation is.
Only one day is involved. The chart itself shows that high readings may subside within a few weeks.
No reason given. [TAG[61] No source explains why shares jumped on October 10.
SOL chart trend
The chart of the currency itself is another story. Here is a snapshot taken from CoinMarketCap on October 12, 2026:
Indicator Value Price $111.57 24-hour Change +2.3% Market Cap $65.72B 24-hour Volume $1.81B (+39.11%) 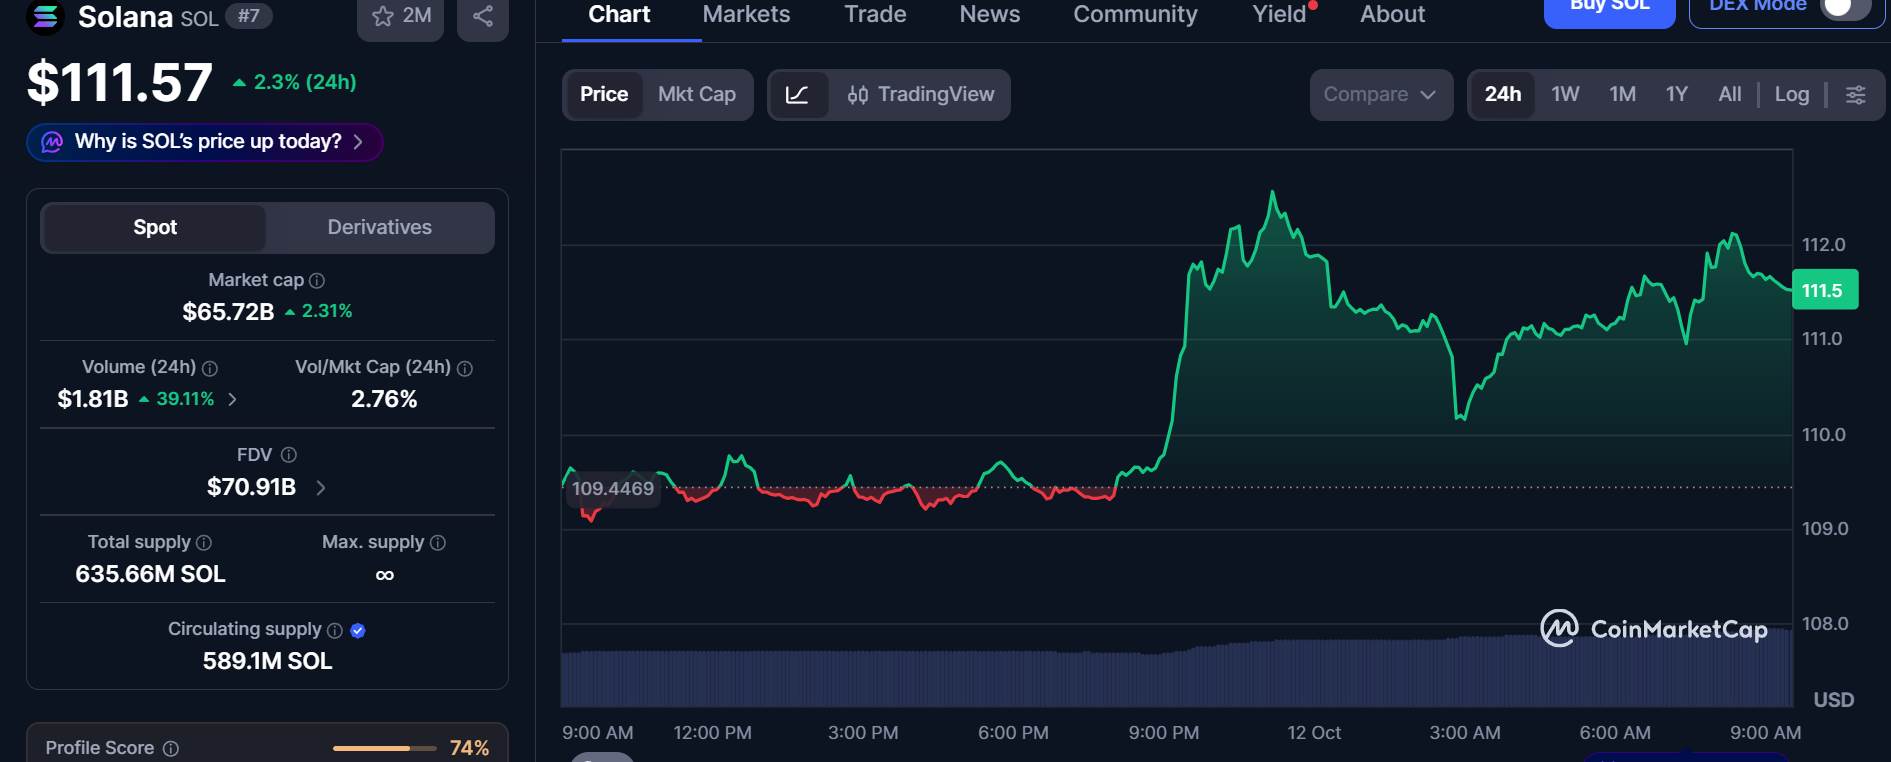 Source: CoinMarketCap real-time data
The 24-hour chart starts at around $109.45 and fluctuates sideways for several hours. Prices jumped above $112 late in the evening, fell back slightly to about $110.20 in the early morning, then recovered to about $112, and finally stabilized around $111.50.
This change started after the October 10 reading and no source linked it to tokenized stock news, so any association should be considered speculation.
The second spot Solana ETF is about to be launched in Hong Kong
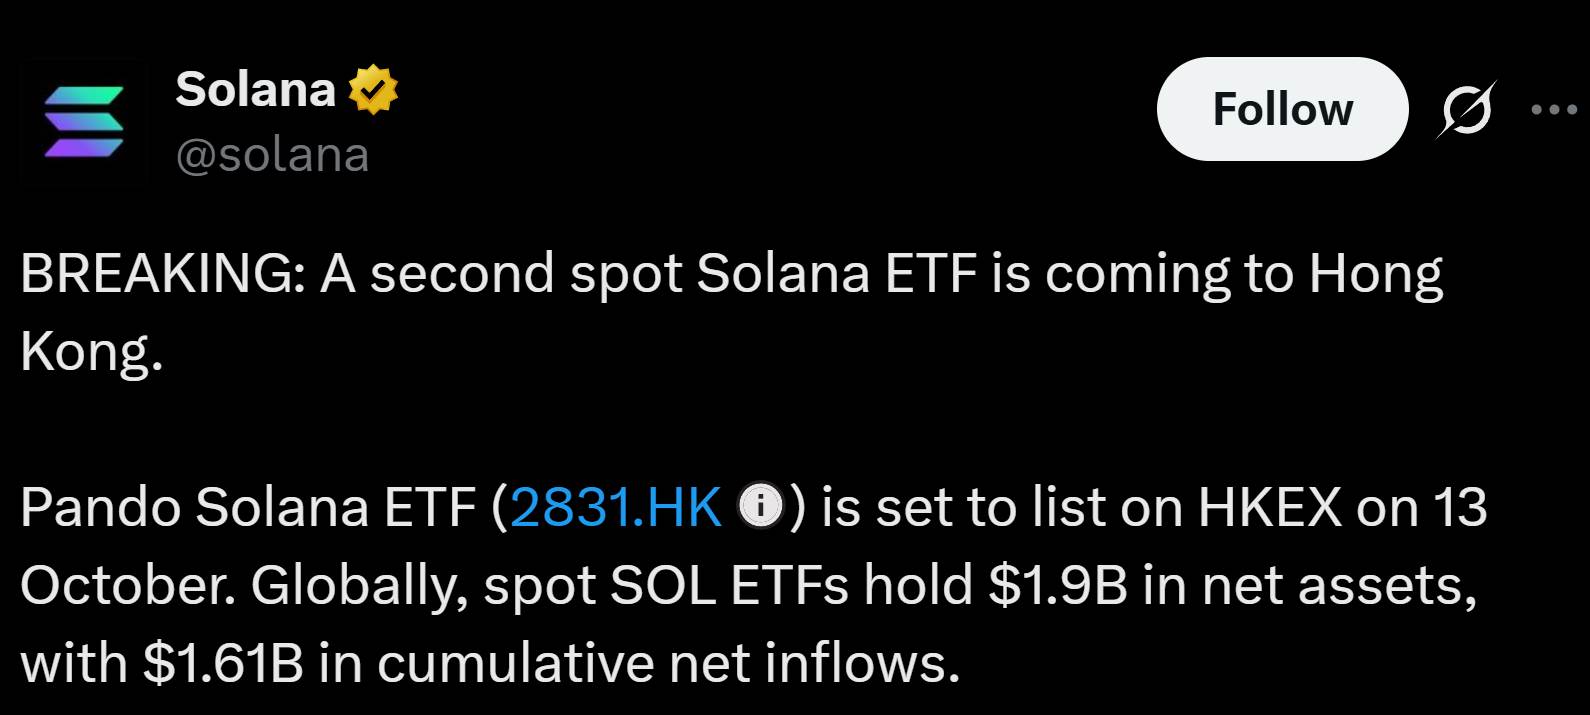
According to official Solana news on the X platform, the second spot Solana ETF is about to be launched in Hong Kong. An ETF (Exchange-Traded Fund) is a fund that trades like a stock and allows people to track the price of a currency without having to directly purchase the currency.
 "Spot" means that the fund holds real tokens.
- Fund: Pando Solana ETF (Code 2831.HK)
- Listing: scheduled to be listed on the Stock Exchange of Hong Kong (HKEX) on October 13
- Global Overview: The spot SOL ETF holds net assets of US$1.9 billion and has a cumulative net inflow of US$1.61 billion (inflows minus outflows)
This listing is only a scheduled plan and has not yet been formally effective, so the date may still change.
What's worth watching next
Anyone following Solana's news today should pay close attention to the following points:
- Whether the share remains above 50% in the next few daily readings.
- New developments on SolanaFloor and Blockworks dashboards.
- Whether other networks will regain trading volume as they did in late August.
- Whether SOL trading remains active or cools down.
Conclusion
Single-day data shows that this network accounts for almost two-thirds of the trading volume of tokenized stocks, which is real news worthy of attention. However, the chart excludes BNB Chain; shares have fluctuated significantly since July, and no one explained the reason for the jump. Until more data arrives, it's wise to follow the data, not the emotions. Please stay tuned for Solana's news today for the latest updates.