Exchange Ranking
 Top Exchanges
 24h Volume Ranking
 Popularity Ranking
 Exchange BTC Balance
 Proof of Reserves
 Decentralized Exchanges
 Funding Rate
 Funding Heatmap
 Liquidation Data
 Max Pain
 Long/Short Ratio
 Whale L/S Ratio
 Binance/Okex/Huobi L/S
 Bitfinex Margin L/S
 ETF Tracker
 Solana ETF
 XRP ETF
 Hong Kong ETF
 Bitcoin Treasuries
 Crypto Reversal
 Ethereum Reserves
 HyperLiquid Wallet Analysis
 Hyperliquid Whale Watch
 Large Transactions
 On-chain Movement
 Bitcoin ROI
 Stablecoin Market Cap
 Options Analysis
 News
News Articles
 Economic Calendar
 Features
 Wallet
 Contract Calculator


 Security
 Collections
 Watchlist
 Following
 XRP
XRP Analysts pointed out that US$1.55 is the key breakthrough level. If XRP breaks through resistance, the target price may reach US$3.20 or even US$10.
Egrag analyzed based on three large-scale expansion cycles in XRP history. Its arithmetic average increase is 1,552%, and the geometric average increase is 1,444%. Currently, XRP prices are still trading above the 50-day and 200-day moving averages, with $1.39 to $1.40 constituting immediate support, while $1.435 is preliminary resistance.
After a strong rise in August, XRP is currently trading around $1.404. Analysts Crypto Patel and Egrag Crypto each proposed different price scenario forecasts. Patel views $1.55 as a key breakthrough point, and once it breaks through, the target will point to $3.20 or even $10; while Egrag measures XRP's previous macro expansion and combines it with current chart levels to evaluate the trend of XRP after it rebounds from its August low.
Crypto Patel outlines US$1.55 breakthrough path
Crypto Patel points out that XRP is still above key accumulation areas and that market structures are strengthening over higher time frames. According to the analyst, if the price exceeds $1.55, subsequent target prices will be set at $3.20 and $10. This judgment is based on the background of XRP's rebound from its August low of $1.00 to $1.58.
The premise for this technical form to be established is that XRP can effectively break the US$1.55 barrier. At the same time, Egrag Crypto used three historical price increases to conduct a detailed examination of XRP's past macro expansion. Among them, the increase in the first cycle reached 2,405%, and the increase in the second cycle was 1,002%.
Egrag calculates the historical expansion of XRP
The third macro expansion cited by Egrag brought an increase of 1,250%. Based on the above data, the arithmetic average is approximately 1,552%. However, Egrag also calculated a geometric mean of approximately 1,444%.
Source: Restoration
He described the geometric mean as a measure of the average compound expansion over these three cycles. These data form the basis for Egrag's macro-cycle calculations. His analysis then turned to the recent price structure of XRP and the key levels visible on the chart.
XRP stays above the key moving average
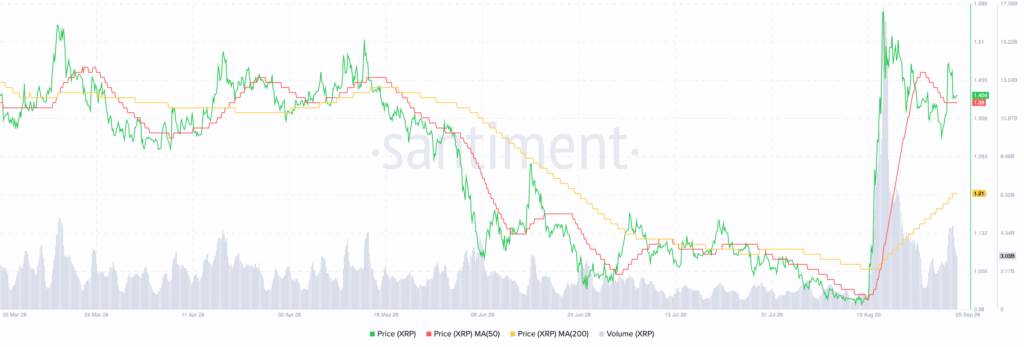
From March to mid-May, XRP fluctuated mainly in the US$1.30 to US$1.50 range. The decline accelerated between late May and June, sending XRP below $1.13. Then, around August 19, XRP hit a low of about $0.99 to $1.00.
Since then, an August breakthrough pushed prices to about US$1.58, accompanied by a significant amplification in trading volume. After this rally, XRP pulled back and stabilized around $1.404. Currently, the 50-day moving average is around $1.39, while the 200-day moving average is around $1.21.
It is worth noting that XRP remains above the two moving averages, and the 50-day moving average has shown an upward trend. Immediate support is at $1.39 to $1.40, followed by $1.35 and $1.21. In terms of resistance,$1.435 constitutes preliminary resistance, while $1.50 and $1.58 are stronger resistance levels. If the price falls below $1.39, it will expose lower support areas below.