Exchange Ranking
 Top Exchanges
 24h Volume Ranking
 Popularity Ranking
 Exchange BTC Balance
 Proof of Reserves
 Decentralized Exchanges
 Funding Rate
 Funding Heatmap
 Liquidation Data
 Max Pain
 Long/Short Ratio
 Whale L/S Ratio
 Binance/Okex/Huobi L/S
 Bitfinex Margin L/S
 ETF Tracker
 Solana ETF
 XRP ETF
 Hong Kong ETF
 Bitcoin Treasuries
 Crypto Reversal
 Ethereum Reserves
 HyperLiquid Wallet Analysis
 Hyperliquid Whale Watch
 Large Transactions
 On-chain Movement
 Bitcoin ROI
 Stablecoin Market Cap
 Options Analysis
 News
News Articles
 Economic Calendar
 Features
 Wallet
 Contract Calculator


 Security
 Collections
 Watchlist
 Following
 BTC
BTC Core Points
Bitcoin fell back after hitting US$82,250. The value of Binance's open interest exceeded US$10 billion. The number of open interests denominated in bitcoin also increased. Trading activity at old export addresses held for more than five years has become more frequent. Spot demand has become the key to breakthrough testing. The September high will be the next resistance level.
Bitcoin's September high becomes the next resistance level
As of writing, Bitcoin was trading at approximately US$79,600, which was the level two days after reaching US$82,250. On the BTC/USD daily chart, prices remain above the 50-day, 100-day and 200-day simple moving averages. These trend reference indicators are between approximately $66,400 and $69,700, confirming the extent to which Bitcoin has recovered since August. 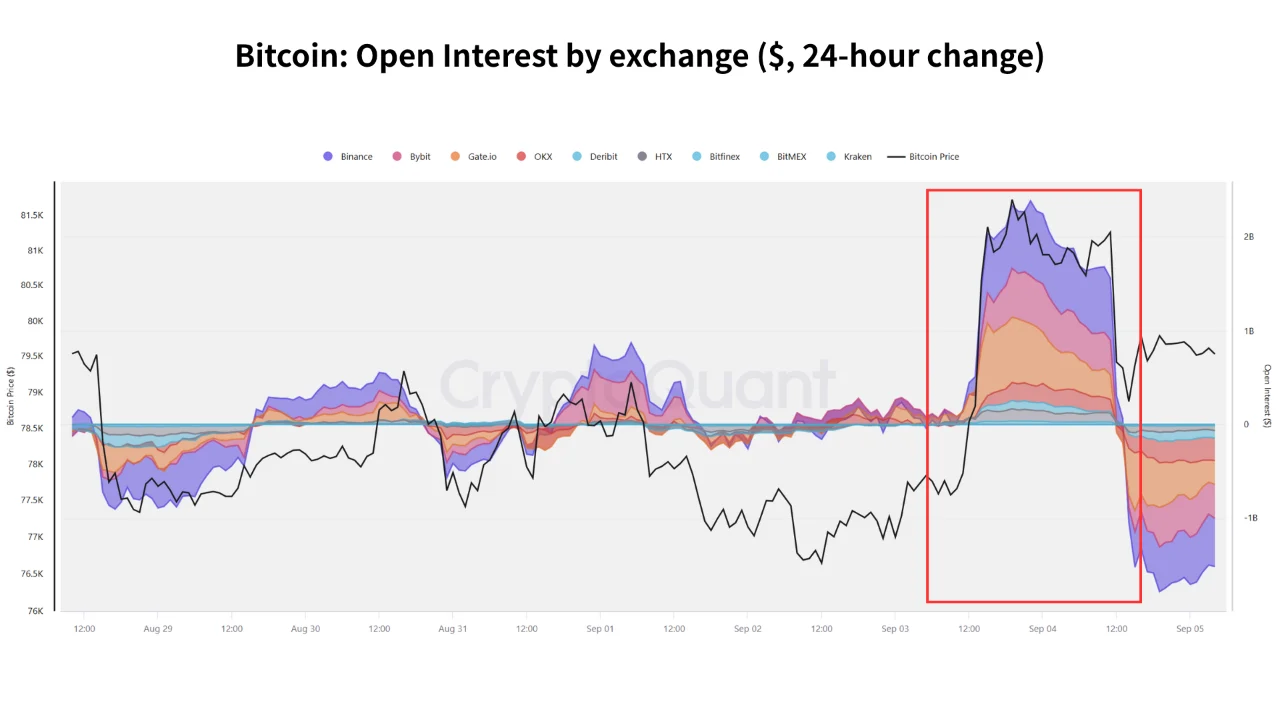 Daily chart of Bitcoin on Bitstamp, showing moving averages and RSI indicators. Their distance from market prices also means they provide limited guidance on immediate support around $79,600. The short-term question is whether Bitcoin can stay within its recent trading range before challenging its September high again. Previous analysis of Bitcoin's recovery level pointed to $81,480 as the first major resistance level. Bitcoin subsequently traded above that level, but its fall back below $80,000 suggests that buyers have not established lasting acceptance above the broader $82,000 region.
Binance open interest exceeds price effect
Darkfost's analysis of CryptoQuant stated that Binance Bitcoin open interest increased by nearly 8% in 24 hours to more than $10 billion, setting the highest dollar value in six months. What happened to Binshang? 10 billion + USD-denominated open interest in Bitcoin. 125,830 BTC outstanding exposure denominated in bitcoin. 37%+ Binance's reported share of open Bitcoin contracts. Part of the increase in the dollar stems from the increase in the value of Bitcoin, which increases the nominal value of existing contracts. However, CryptoQuant's bitcoin-denominated indicator also climbed, suggesting that outstanding exposure did expand after removing most price effects. The reading of 125,830 BTC is a unit of measurement and does not prove that the same amount of physical Bitcoin was deposited or locked as collateral. It represents the notional contract size in bitcoin. Binance Bitcoin open interest chart highlighting the $10 billion milestone. Open interest also doesn't reveal whether aggressive buyers, hedging activity or new short positions are driving the increase. Every futures contract has long and short ends. Funding rates, futures basis and order flow data are needed to determine which party is paying more enthusiasm for exposure. This means that more nominal futures exposure remains open and vulnerable to sudden price fluctuations. If traders start closing positions collectively, this amplifies volatility.
Activity of five-year holders is also rising
Another CryptoQuant analysis found that the 90-day moving average of spending output on Bitcoin held for more than five years has reached approximately 1,500 BTC. The reading is about twice the level in May. STXO chart from original Bitcoin holders (>5 years), source: CryptoQuant. Bitcoin records the balance as an unspent transaction output, often called UTXO. Once an output is included in a new transaction, it becomes a spent output. Their age indicates how long the coins have not been touched, but does not explain why they moved or where they ended up going. Some of these transfers may signal a sale, but wallet consolidations, custody changes and security upgrades can also send the same on-chain signals. Darkfost cited wallet reorganization after the Coldcard incident as a possible explanation, although the indicator failed to identify personal motives. Early reports on Coldcard wallet vulnerabilities explain how defensive wallet migration can awaken dormant coins without immediately creating a sell supply. Therefore, the 1,500 BTC figure measures an increase in older output activity. It is not the amount that long-term holders sell in a single session.
Whale deposits bring Bitcoin closer to liquidity
Some new activities have also spread to exchanges. The third CryptoQuant analysis report stated that as BTC rose from more than US$60,000 in the medium term to more than US$70,000 in the late period, large bitcoin deposits increased, of which Binance received a large amount of the largest inflows. The activity is not limited to Bitcoin: Altcoin deposit transactions reportedly rose to about 45,000 in seven days from about 15,000-20,000 at the August low. Moving BTC to an exchange makes it easier to trade, but a deposit does not mean completing the sale. Instead, these coins may be used for market making, arbitrage, custody or collateral. Rising currency inflows and higher futures open interest partly reflect related activity. Some BTC deposits may support coin-margin positions or other trading strategies, although the available data does not link specific deposits to individual futures contracts. Many of Binance's derivative activities can also use stablecoins as collateral, so these two sets of data should not be considered direct equivalents.
Visible data
- Futures exposure increased in both U.S. dollar and bitcoin denominated.
- Older outputs start to move more frequently.
- Deposits on large exchanges also increased.
What the indicator cannot display
- Whether older coins were transferred for sale.
- Whether exchange deposits fund futures positions.
- Which party initiated new derivatives exposure.
How to distinguish demand from speculation
Spot activity should accompany the next breakthrough
If spot market activity strengthens accordingly, breaking through September resistance will be more convincing. Spot purchases provide direct demand for the underlying asset without relying on futures contracts that may later be liquidated. Existing open interest data confirms increased futures participation, but they do not measure how much unleveraged demand is waiting above $80,000. When Bitcoin once again visits the resistance zone, spot volume and order flow will provide a more direct test.
More leverage below resistance increases vulnerability
Open interest confirms that positions are being added; but this does not establish the health of the underlying trend. If exposure continues to expand and BTC is repeatedly unable to move forward, more positions are vulnerable to sudden movements outside the range. Funding rates and futures basis can add background information. Rapidly rising positive funding rates suggest that leveraged long positions are increasingly costly to maintain and that if prices fall, the risk of unwinding will also increase.
Net flow shows whether an exchange retains deposits
Total inflows measure the amount of BTC entered the wallet of a known exchange and do not deduct withdrawals. Net flow provides a clearer view of whether balances controlled by exchanges have increased over the same period. Even positive net flow does not prove that retained coins will be sold. However, it can show whether more BTC is still readily available in the exchange infrastructure as the market tests resistance levels.
Strategy becomes Tom Lee's top position in his $4.5 billion ETF
Breakthroughs now require buyers, not just activity
Just as old coin and whale deposits became more active, Bitcoin attracted new futures exposure. Whether this activity supports or undermines the recovery now depends on the strength of spot demand. If spot activity expands without the same sharp increase in leverage exposure, a move to break through the resistance zone will be more credible. Until then, the increase in participation suggested that Bitcoin was once again attracting attention, rather than that buyers had secured its next round of gains. This article is for information reference only and does not constitute investment advice.