Exchange Ranking
 Top Exchanges
 24h Volume Ranking
 Popularity Ranking
 Exchange BTC Balance
 Proof of Reserves
 Decentralized Exchanges
 Funding Rate
 Funding Heatmap
 Liquidation Data
 Max Pain
 Long/Short Ratio
 Whale L/S Ratio
 Binance/Okex/Huobi L/S
 Bitfinex Margin L/S
 ETF Tracker
 Solana ETF
 XRP ETF
 Hong Kong ETF
 Bitcoin Treasuries
 Crypto Reversal
 Ethereum Reserves
 HyperLiquid Wallet Analysis
 Hyperliquid Whale Watch
 Large Transactions
 On-chain Movement
 Bitcoin ROI
 Stablecoin Market Cap
 Options Analysis
 News
News Articles
 Economic Calendar
 Features
 Wallet
 Contract Calculator


 Security
 Collections
 Watchlist
 Following
 SUI
SUI Sui 市场再度升温:多空分歧加剧,技术面指向何方?
Sui(SUI)的市场热度再次上升。目前 SUI 交易价格为 0.7800 美元,过去 24 小时内上涨 7.55%。社交媒体上的观点呈现出截然不同的两极分化:一方账号炒作在即将到来的事件前价格将冲向 20 美元;而另一位知名交易者则指出图表上出现了看涨背离信号。
本文将对这两种说法进行剖析,并结合实际的支持位和阻力位,探讨 SUI 接下来的走势。
加密新闻今日焦点:SUI 清算数据暗示空头挤压
窗口时间 总清算金额 多头清算 空头清算 1小时 $1.12K $728.57 $387.06 4小时 $372.41K $9.87K $362.54K 12小时 $926.61K $39.26K $887.35K 24小时 $1.10M $91.26K $1.01M 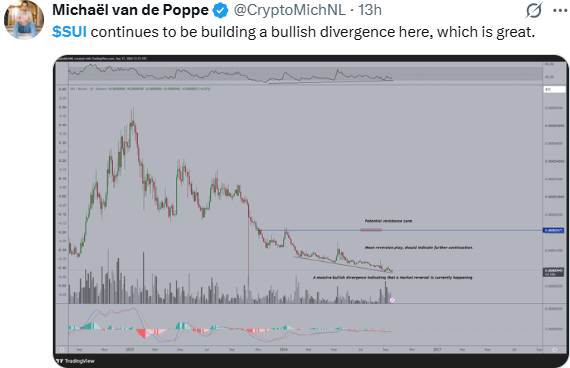 根据 Coinglass 数据显示,空头占据了 24 小时清算量的 92% 以上。这意味着押注 SUI 下跌的交易者因价格上涨而被强制平仓,需要买回头寸,这在客观上进一步推动了价格的上涨。
  加密新闻:交易者指出 SUI 出现看涨背离
SUI 持续形成看涨背离形态,被评价为“极好”。其图表标记显示这是一次“均值回归”交易机会,预示着进一步的延续性,并可能在当前价格上方形成一个潜在的阻力区。
 Source: X Platform Data This is the technical opinion stated by the trader, not confirmed data. CoinGabbar cannot independently verify how this divergence unfolded here.
Sui News Today: Social media target price forecasts for $SUI
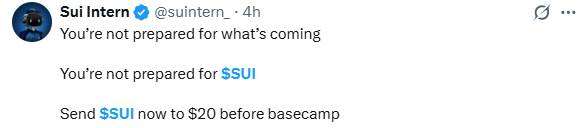
An article from the account Sui Intern (suintern) called on followers to buy SUI immediately and claimed that the price would rise to US$20 before the "Basecamp" event, but did not provide any supporting data or timetable.
This is an unverified, hypation-driven social media statement rather than rigorous analysis. CoinGabbar cannot confirm any basis for the $20 target price. Therefore, it should be regarded as speculative remarks rather than formal predictions.
SUI Technical Analysis
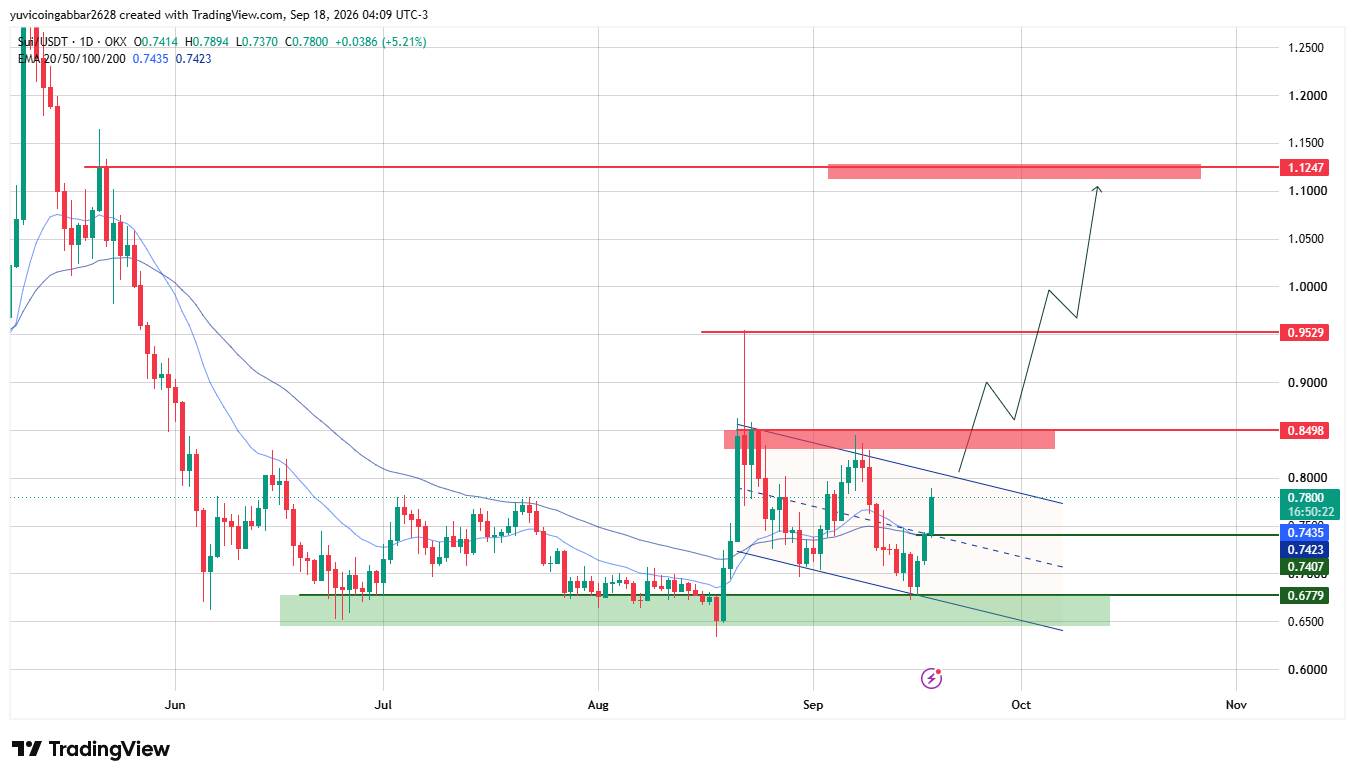
SUI's current trading price is US$0.7800, up 5.21% during the current K-line cycle. Since the beginning of September, prices have fluctuated within a gradually narrowing channel, defined by two convergent trend lines. As each K line is formed, the channel range has continued to narrow.
This type of channel usually means that the market is gathering strength and preparing for a bigger market, rather than simply moving in one direction. Currently, SUI are trading near the upper edge of the channel, just above the EMA (Exponential Moving Average) cluster. After rebounding from the US$0.6779 region, the EMA cluster has shifted from resistance to support. Temporarily remaining within the channel means that prices are still being consolidated. But if prices could close cleanly above the upper trend line and the $0.8498 resistance zone, it would be seen as a healthy break into the channel, opening the door to $0.9529 and then to the $1.1247 zone. Conversely, if the SUI falls back below the EMA cluster and the lower trend line, it indicates that the channel is resolving downward and the US$0.6779 support area will become the focus again.
SUI Key Indicator Levels
- Resistance Level 3: $1.1247
- Resistance Level 2: $0.9529
- Resistance Level 1 (Recent): $0.8498
- Instant Price Reference: $0.7800
- Support Level: $0.6779
SUI Price Forecast: What may happen next?
Bullish scenario:
If the range of US$0.7423 to US$0.7435 near the EMA cluster is held and the recent resistance level of US$0.8498 is cleared, the path to the US$0.9529 and ultimately US$1.1247 area will remain open.
Bear scenario:
若收盘价回到 EMA 集群(0.7423 美元)下方,将使近期的反弹受到质疑,并存在滑落回 0.6779 美元支撑区的风险。
SUI 价格预测:SUI 能触及 1.1247 美元吗?
这是图表上标记的最高水平,理论上是的,但这需要一个多阶段的运动过程,而非单一波段的拉升。SUI 首先需要清除 0.8498 美元,然后是 0.9529 美元,之后 1.1247 美元区域才会进入视野。
SUI 2026 年价格预测:专家观点
根据 CoinGabbar 分析师的观点,大量的空头清算和 EMA 的收复都指向了短期的看涨动能,社交媒体上标记的看涨背离也与这一图景相符。
另一方面,20 美元的目标目前没有任何图表可见的依据支持。0.8498 美元才是检验此次反弹是否具有持续性的真正短期测试点。
免责声明
本文仅供信息参考,不构成财务建议。加密货币市场波动性极高,SUI 的价格可能会迅速变化。文中讨论的分析和价格水平基于市场数据和技术模式,并不保证准确性。在进行任何涉及 SUI 的交易或投资决策之前,请务必自行研究并考虑您的风险承受能力。