Exchange Ranking
 Top Exchanges
 24h Volume Ranking
 Popularity Ranking
 Exchange BTC Balance
 Proof of Reserves
 Decentralized Exchanges
 Funding Rate
 Funding Heatmap
 Liquidation Data
 Max Pain
 Long/Short Ratio
 Whale L/S Ratio
 Binance/Okex/Huobi L/S
 Bitfinex Margin L/S
 ETF Tracker
 Solana ETF
 XRP ETF
 Hong Kong ETF
 Bitcoin Treasuries
 Crypto Reversal
 Ethereum Reserves
 HyperLiquid Wallet Analysis
 Hyperliquid Whale Watch
 Large Transactions
 On-chain Movement
 Bitcoin ROI
 Stablecoin Market Cap
 Options Analysis
 News
News Articles
 Economic Calendar
 Features
 Wallet
 Contract Calculator


 Security
 Collections
 Watchlist
 Following
 SHIB
SHIB SHIB仍处收敛形态,$1目标缺乏技术路径支撑
SHIB目前仍处于一个不断收紧的形态之中,下行阻力与上行支撑共同构成了近期的技术结构。8月份复苏后动能有所减弱,RSI指标保持中性,MACD信号显示短期上涨动力正在消退。实现$1的目标需要极端的重新定价,而当前的图表并未显示出通向该水平的直接技术路径。交易者正在评估在当前的技术条件和近期市场行为下,达成这一大胆$1目标的可行性。
迈向$1存在巨大差距
“SHIBMortal”最近关于Shiba Inu的提问引发了市场对$1目标的关注。该帖子询问这种估值是否能在30天内实现。然而,附带的图形并未提供具体的技术路线,而是将$1的数字与Shiba Inu的品牌形象并列展示。相较于长期情景,这一时间框架使得该目标显得更为苛刻。当前的市场结构为评估这一距离提供了更清晰的参考依据。
显示的图表显示当前价格约为$0.00000506,远低于提议的$1估值。这一差额要求代币现有供应量经历非凡的重新定价。市场数据显示,流通中的SHIB数量约为589.2万亿枚。若达到$1,其市值将高达约$589万亿。因此,该目标涉及的价值转型远远超出了普通的短期市场波动范围。
日线结构显示价格动作趋于收敛
Daily charts show prices experienced a long-term decline from June lows after recovering in May. Prices then established a bottom in the $0.000040 to $0.000045 area, which became an important foundation during the summer recovery. 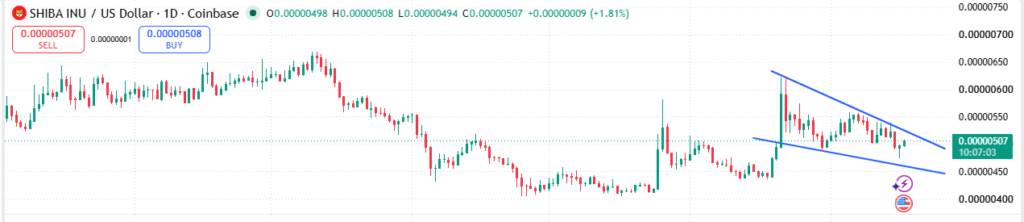 Source: Tradingview brought a rapid expansion towards approximately $0.000058 in late July, and then prices fell back until August formed another wave of gains. The second rally hit approximately $0.000062 and encountered downward resistance.
Since the August high, lower highs have formed below the upper blue trend line. At the same time, the uptrend line below continues to climb below prices. These two boundaries together constitute a narrowing pattern within the recent trading range. The latest K-line showed an increase of about 1.61%, but prices remained below the downward resistance line above. Therefore, the trend of the structure depends on whether a breakthrough or a support failure.
MACD and RSI show moderate momentum
Following strong momentum in August, the MACD indicator has weakened. The latest histogram reading has entered the negative territory, and as the recent upward momentum has subsided, the MACD double line is also turning downward. 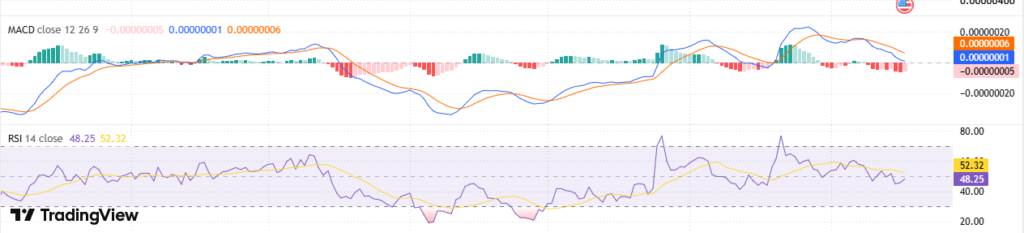 Source: Tradingview As of writing, the RSI reading was around 47.98, with its moving average close to 52.30. These readings indicate that kinetic energy is in the middle of the indicator range. No indicator currently signals extreme overbought or oversold.
因此,技术面设置在收缩形态周围保持平衡。若突破下行阻力,将对近期形成的更低高点序列构成挑战;反之,若跌破上升支撑,则可能暴露出6月和7月确立的低点区域。对于SHIBMortal提出的$1问题,图表提供的证据有限,主要显示的是盘整而非朝向遥远目标的直接序列。当前的焦点 remains 在于SHIB能否果断解决当前的形态结构。