Exchange Ranking
 Top Exchanges
 24h Volume Ranking
 Popularity Ranking
 Exchange BTC Balance
 Proof of Reserves
 Decentralized Exchanges
 Funding Rate
 Funding Heatmap
 Liquidation Data
 Max Pain
 Long/Short Ratio
 Whale L/S Ratio
 Binance/Okex/Huobi L/S
 Bitfinex Margin L/S
 ETF Tracker
 Solana ETF
 XRP ETF
 Hong Kong ETF
 Bitcoin Treasuries
 Crypto Reversal
 Ethereum Reserves
 HyperLiquid Wallet Analysis
 Hyperliquid Whale Watch
 Large Transactions
 On-chain Movement
 Bitcoin ROI
 Stablecoin Market Cap
 Options Analysis
 News
 Articles
 Economic Calendar
 Features
 Wallet
 Contract Calculator


 Security
 Collections
 Watchlist
 Following
 BTC
Bitcoin's relative structure has improved. ETF capital inflows have recovered and multiple sweeps have supported the formation of higher lows.
With the recovery of exchange-traded fund (ETF) capital inflows and the market's multiple liquidity sweeps, Bitcoin is forming a gradually forming "higher lows" structure. ETF capital flows in September shifted from previous net outflows to stronger net inflows, although demand slowed after the main buying phase of the month.
Gold fell sharply in intraday trading and then rebounded. Currently, 41.61 has become the key support level, while the 42.20 to 42.30 region is the rebound area that buyers have focused on in the near future. As demand for ETFs improves, Bitcoin shows signs of structural transformation; at the same time, repeated liquidity sweeps and the fall in gold prices have jointly reshaped the broader market environment after experiencing relative weakness.
Liquidity sweep reshapes relative structure
Analyst CRYSTTOWZRD pointed out that the downward trend of Bitcoin against gold has been broken after clearing previous lows. This trend formed what the analyst called a "macro higher low." The current structure allows the market to test the upper boundary. 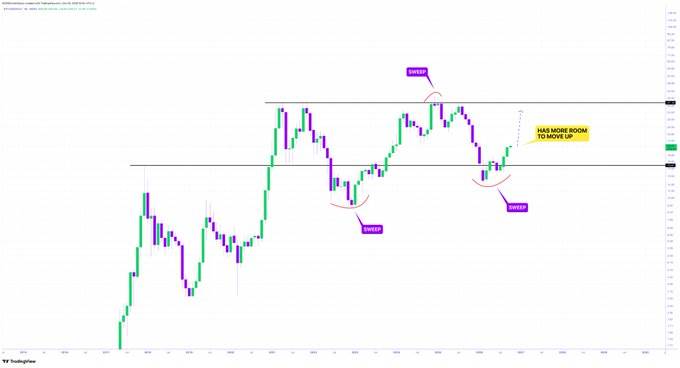
Bitcoin charts show that prices have undergone multiple liquidity sweeps near early reaction areas. After breaking through these levels, prices fell back inside the range. Each recycling weakens the immediate impact of those downward breakthroughs. The most recent sweep took on greater weight because the buyer quickly regained the area. This responsive operation created a structure of higher lows after a broader decline. Currently, the upper horizontal boundary has become the next major technical reference point.
Prices have returned to cap levels several times after earlier rejections. Sellers curbed these attempts but did not trigger a deeper decline. Therefore, once the interval is confirmed to be broken, the visible structure will change.
ETF fund flows turned positive in September
ETF fund flows showed repeated outflows in early September. Negative trading days between September 8 and 11 drove the decline in cumulative capital flows. Another outflow sequence occurred around September 15 and 16. 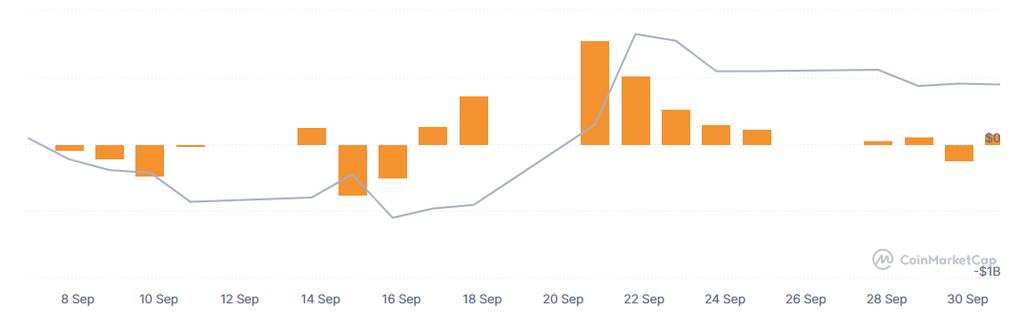
Around September 17, the capital situation changed and daily net inflows reappeared. The positive funding pillar continued to expand on September 18 and 19. The cumulative funds line then recovered strongly from its low on September 16.
The largest inflows occurred around September 21, followed by another strong trading day. These two days produced the most obvious upward movement in cumulative net capital flow. Smaller positive capital flows continued until September 25, before weakening momentum. Later activities were mixed, with only the modest inflow on September 28 and 29. September 30 showed another significant outflow. Even so, cumulative capital flows are still well above the lows of early September.
Gold fell back before late trading and then rebounded.
Gold opened at 42.75 and climbed to an intraday high of 43.09. As selling pressure increased after early gains, momentum later weakened. After about 09:30, the decline accelerated. 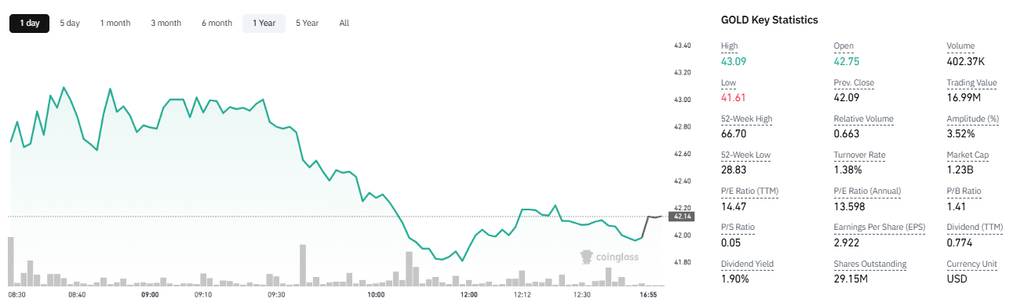
The most severe selling occurred between approximately 09:40 and 11:00. Prices eventually hit intraday lows of 41.61. During the decline, trading volume also increased.
Subsequently, the buyer deployed defense in the 41.80 to 41.90 area and began to gradually rebound. The price has returned to 42.00 and is close to the 42.20 area. The rebound process was not smooth, with multiple pullbacks in the afternoon.
The chart shows that resistance is gradually building in the rebound area of 42.20 to 42.30. Prices have difficulty maintaining momentum after hitting this area. It then moved slightly sideways before bouncing north to a position of about 42.14.
In terms of intra-day volatility, the period was strong with an amplitude of 3.52%. The reported trading volume was 402.37K, and the relative trading volume was 0.663. 41.61 The low point of 2010 is still the key lower reference level for this period.