Exchange Ranking
 Top Exchanges
 24h Volume Ranking
 Popularity Ranking
 Exchange BTC Balance
 Proof of Reserves
 Decentralized Exchanges
 Funding Rate
 Funding Heatmap
 Liquidation Data
 Max Pain
 Long/Short Ratio
 Whale L/S Ratio
 Binance/Okex/Huobi L/S
 Bitfinex Margin L/S
 ETF Tracker
 Solana ETF
 XRP ETF
 Hong Kong ETF
 Bitcoin Treasuries
 Crypto Reversal
 Ethereum Reserves
 HyperLiquid Wallet Analysis
 Hyperliquid Whale Watch
 Large Transactions
 On-chain Movement
 Bitcoin ROI
 Stablecoin Market Cap
 Options Analysis
 News
 Articles
 Economic Calendar
 Features
 Wallet
 Contract Calculator


 Security
 Collections
 Watchlist
 Following
 BTC
Core Points
The S & P 500 climbed above 7,840 points as market sentiment improved as U.S. Treasury yields, oil prices and the U.S. dollar fell back. Bitcoin's performance after the stock market hit a record record has shown volatility: sometimes it rises, sometimes it falls. The key is that the market background conditions driving this record are far more important than the record itself.
Relieving bond pressure helped stock markets hit new highs
On October 6, the S & P 500 index broke through the 7,840 mark, setting a record high. This trend was due to a correction in oil prices and a decline in U.S. Treasury yields. According to the Washington Post, the index has surpassed previous levels; Reuters pointed out that the yield on the 10-year U.S. bond fell about 2.1 basis points to 5.28%. Optimism about AI-related companies and the upcoming earnings season further pushed the index higher. In addition, the US dollar weakened after experiencing previous strength, boosting the market sentiment for dollar-denominated assets. However, long-term borrowing costs remain high, with intraday 30-year U.S. bond yields close to 5.66%. Therefore, although this market rebound has brought a certain degree of relief, it has not returned to the low-yield environment of the early crypto market mania.
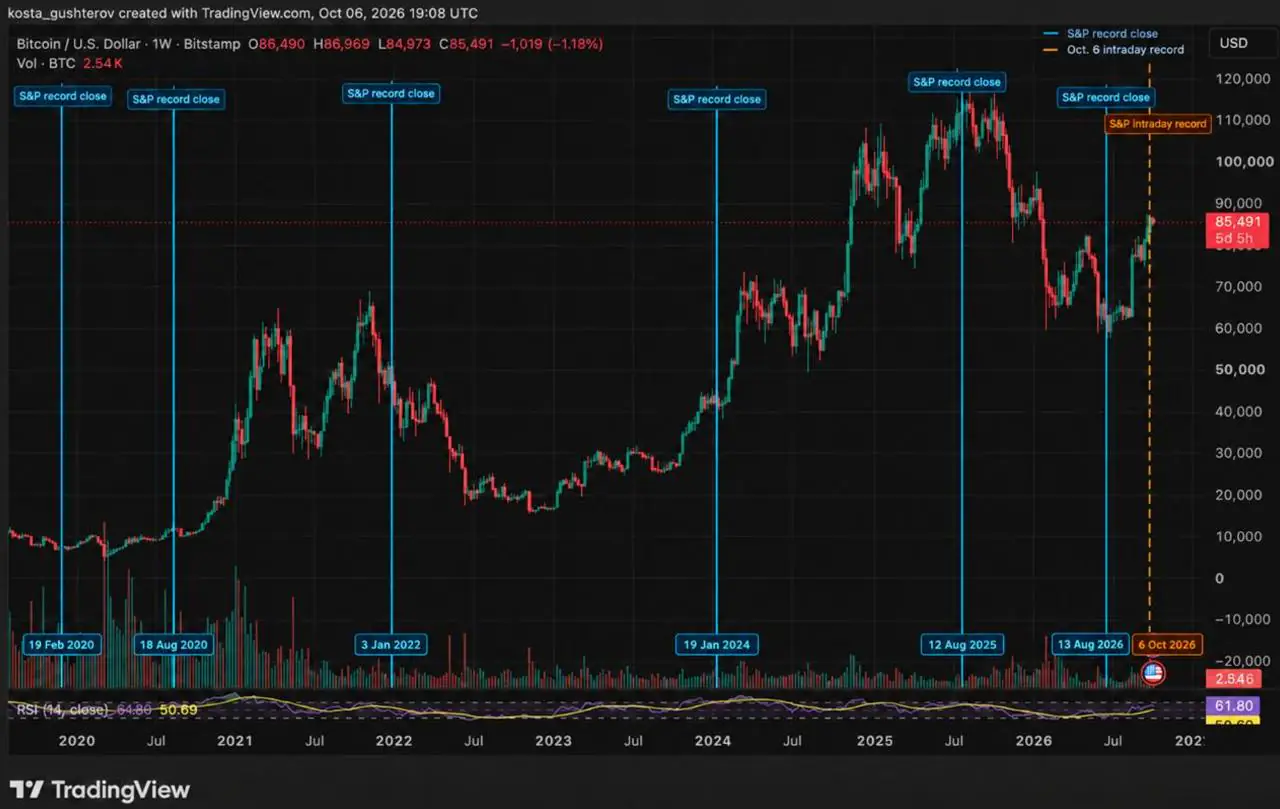
Chart source: TradingView, BTC/USD data on Bitstamp
Same stock market event, completely different Bitcoin outcome
The new S & P 500 highs can serve as analytical nodes, but have never served as an independent Bitcoin signal. For example, the August 2025 market should be regarded as a complete market period, as there were consecutive record movements during this period. Treating each new high as an independent Bitcoin trigger would exaggerate the validity of the evidence.
2020: Two sides in half a year
When the S & P 500 index set a record in February 2020, Bitcoin was trading at approximately $9,600. Then the impact of the COVID-19 epidemic hit, and investors turned to cash holding, causing Bitcoin to fall sharply with the stock market. This record marks the end of a market phase rather than the beginning of a sustained rise. However, the situation in August of the same year was completely opposite. Interest rates were low, central banks provided unprecedented liquidity, and the dollar weakened. Although Bitcoin did not rise in a straight line after the record was set, the subsequent months became an important part of its entry into the 2020-21 bull market. The contrast between this and February stems from the different macro environments in which the two records were located.
2022 and 2024: Two other answers
On January 3, 2022, the S & P 500 index closed at a new high again, when the Bitcoin price was close to $46,500. The market trend has shifted towards tightening policy by the Federal Reserve, rising yields and increasing financing costs. Bitcoin's attempt to rebound finally gave way to a broader downward trend as investors reassess risky assets in a high-interest rate environment. The situation in January 2024 is different. In the early days of trading in the U.S. spot Bitcoin ETF, there was a correction in Bitcoin, and early buyers took profits. The market is digesting this major structural change. Then in March, Bitcoin hit a new all-time high. This process shows that certain cryptocurrency catalysts can shape the trend of Bitcoin, even if stocks still form the broader market context.
Historical patterns
Bitcoin performs well when strong stock markets coincide with loose financial conditions or strong demand for specific cryptocurrencies. When liquidity shocks or tighter monetary policies dominate the market, Bitcoin faces difficulties.
The current context remains unique
The current immediate environment has one thing in common with the more supportive fragments: financial pressures eased during the trading day. Lower oil prices eased some inflation concerns, while lower yields and a weaker dollar provided room for stocks to resume. However, the 10-year yield is still above 5%, far short of the interest rate environment that supports the 2020-21 market. The dollar's decline follows its previous strength, and it is unclear whether this trend will develop into a broader trend or just a short-term response to changes in interest rate expectations.
比特币自身也拥有动能来源。持续的现货买入行为提供了不同于主要由期货杠杆或空头回补驱动的价格变动信息,使得资产内部的市场数据至少与标普500的表现同样相关。
什么能让这一纪录对比特币更具意义?
- 美国国债收益率:多日的下跌将降低风险资产的主要障碍;若再度上升,将迅速恢复压力。
- 美元指数:进一步的走弱可能使全球金融条件不再那么紧缩;若回到近期高位,则指向相反方向。
- 比特币现货需求:基础市场的持续买入比快速衍生的价格变动提供更坚实的证据。
- 市场广度:由少数几家人工智能巨头主导的反弹,与股票、债券及其他风险资产广泛参与所传递的信息截然不同。
标普500的新高反映了这样一个交易日:随着收益率和美元压力的减轻,股票投资者接受了更多的风险。早期的纪录时期表明,比特币在同一事件后可能出现上涨、滞后或下跌。接下来收益率、美元以及比特币自身需求的走向,将决定这是否仅是一次由股市引领的运动,还是会演变为风险偏好的更广泛转变。
本文仅供参考,不构成投资或交易建议。历史市场表现不能保证未来结果。