Exchange Ranking
 Top Exchanges
 24h Volume Ranking
 Popularity Ranking
 Exchange BTC Balance
 Proof of Reserves
 Decentralized Exchanges
 Funding Rate
 Funding Heatmap
 Liquidation Data
 Max Pain
 Long/Short Ratio
 Whale L/S Ratio
 Binance/Okex/Huobi L/S
 Bitfinex Margin L/S
 ETF Tracker
 Solana ETF
 XRP ETF
 Hong Kong ETF
 Bitcoin Treasuries
 Crypto Reversal
 Ethereum Reserves
 HyperLiquid Wallet Analysis
 Hyperliquid Whale Watch
 Large Transactions
 On-chain Movement
 Bitcoin ROI
 Stablecoin Market Cap
 Options Analysis
 News
 Articles
 Economic Calendar
 Features
 Wallet
 Contract Calculator


 Security
 Collections
 Watchlist
 Following
 BTC
Market Review from October 5 to 8
From October 5 to 8, the cryptocurrency market experienced a significant correction, with the price of Bitcoin falling by 7.59%. After hitting a low of $80,393, the price rebounded to about $82,800. Despite the rebound, multiple indicators still remind investors to remain cautious. Market tensions and changes in funds flowing to exchange platforms have maintained uncertainty, while the overall trend remains upward.
Brief Highlights
- From October 5 to 8, Bitcoin fell 7.59%, before recovering to approximately $82,800.
- The decline in funding rates and open interest volume reminds investors to remain vigilant.
- The market pressure index fell back to 7 after reaching a weekly peak of 49.9.
- If it can regain its footing above $83,600, it may mark the end of the correction; but the risk of a decline towards $77,700 remains.
Bitcoin: Short-term correction weakens market momentum
Bitcoin fell back from a peak of US$87,000 and later recovered some of its lost ground. The rebound suggests buyer power is returning after several difficult trading sessions. However, the current rebound is not enough to confirm the complete end of the correction. Therefore, investors must pay close attention to the next price trend.
根据CryptoQuant的数据,在所研究的时间段内,交易所的资金流向发生了变化。从10月7日至9日,平台记录了11,325 BTC的流出量。在整个10月3日至9日期间,总流出量达到7,520 BTC。这些数据反映了显著的资金流动,但其解读需要区分每日流量与总体余额。
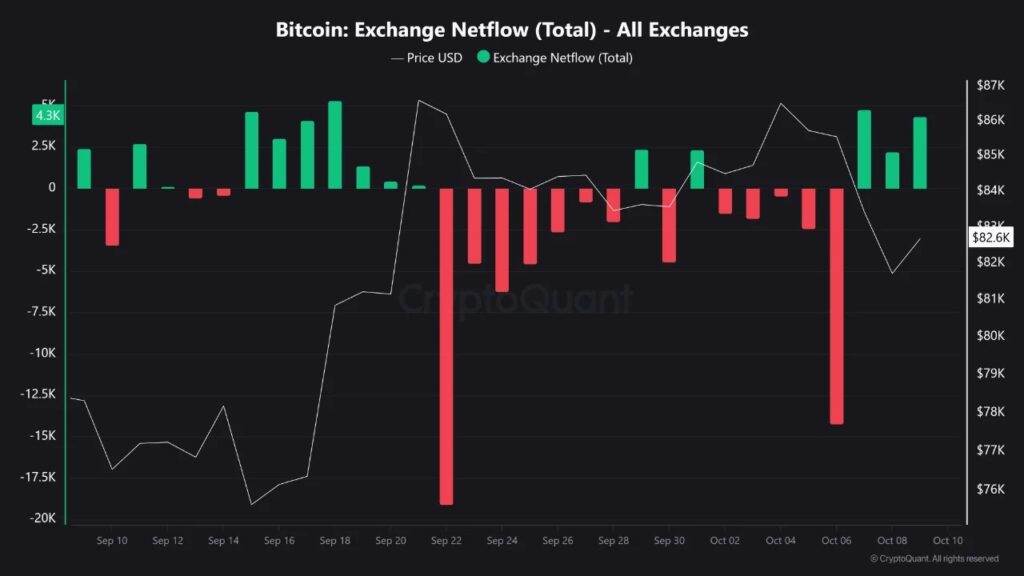
来源:CryptoQuant。10月初,随着BTC回撤至82,600美元附近,从交易所平台流出的比特币数量加剧。
与此同时,CoinNiel分析师指出多个值得警惕的信号。与月初相比,资金费率有所下降,未平仓合约量也有所回落。这些变化表明衍生品市场中的交易者持仓策略发生了转变。同时,现货ETF出现负流入以及多头头寸的减少,进一步增加了价格下行压力。
压力指数回落,反映近期紧张局势缓解
比特币压力指数用于衡量市场中抛售浪潮的强度。据分析师Axel Adler Jr.指出,该指标在10月7日创下49.9的周度高点。当数值介于40至55之间时,表明投资者之间存在较高的紧张情绪。然而,在过去三个月中,该指数并未超过55的阈值。
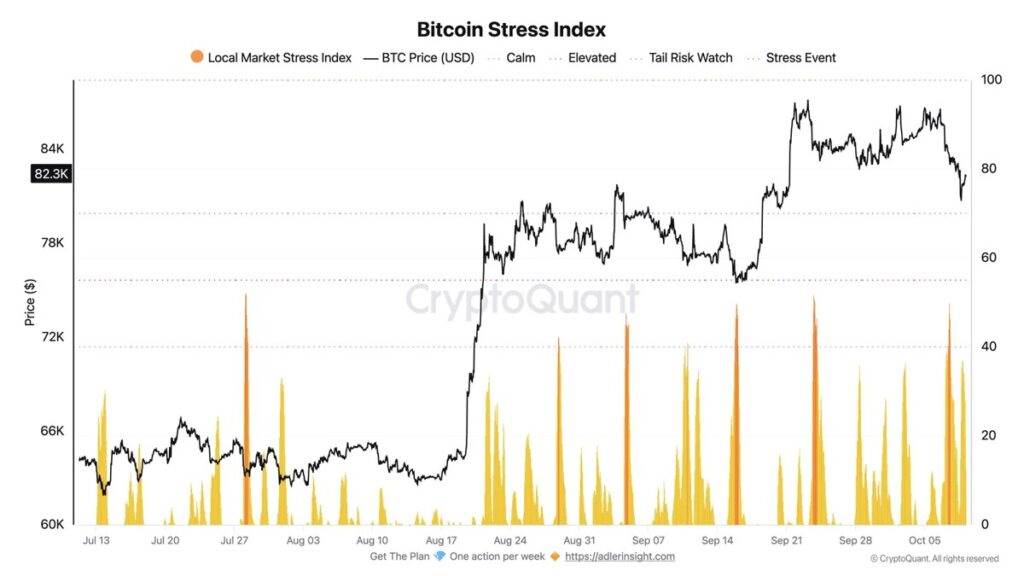
来源:CryptoQuant。2026年7月至10月期间,比特币压力指数显示出多次市场紧张高峰,而在最近一次回调后,BTC价格在82,300美元附近徘徊。
The significant liquidation events recorded on the futures market on October 7 and 8 subsequently eased. This trend indicates that the selling pressure observed during this period is weakening. As a result, the stress index fell back to 7, corresponding to a relatively calm market environment. However, this improvement does not guarantee that the buyer will be able to regain control sustainably.
Axel Adler Jr. identified two key levels to focus on when assessing the risk of a new round of downside. If the stress index is above 55 and the price is below $80,700, this will be an important warning signal. The combination of these two factors may signal a new phase of tension. Before then, the market's calm return should be interpreted with caution.
What key points will guide the next price trend?
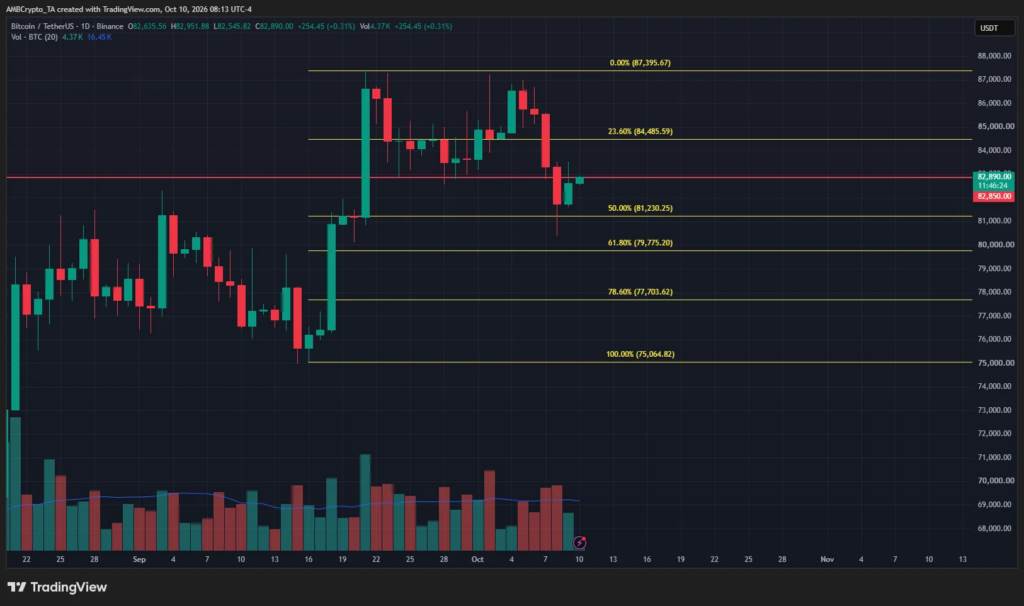
On the daily chart, despite the recent correction, the structure of Bitcoin remains bullish. However, prices have fallen below the 50% Fibonacci retracement level at $81,230. This trend shows that buyers have not yet completely eliminated the impact of the decline. The possibility of a further decline towards $77,700 remains.
Source: TradingView. Bitcoin rebounded to around $82,890 after a correction, and the Fibonacci indicator identified potential support levels of $81,230 and $77,704.
In the short term, if it can remain above the support level, it may help price stabilization. However, market indicators have not yet confirmed a sustainable recovery in demand. Capital flow, capital rates and open interest volume related to the exchange platform are still important aspects that need to be monitored. Their evolution will help to better understand the strength of the current rebound.
The level of US$83,600 has now become an important reference for judging subsequent trends. If this barrier can be broken again, it may indicate that the correction is coming to an end. On the contrary, if it falls below US$80,700 again and the pressure index rises, the downside risks will increase. Therefore, the market's response near these key points will serve as a guide for future analysis.
To sum up, despite a 7.59% decline in early October, Bitcoin still retains a bullish structure at the daily level. In the short term, investors should mainly focus on the resistance level of $83,600 and the risk of a decline towards $77,700. Whether the rebound continues will depend on the ability of prices to break through the next resistance, and stress indicators will help assess whether selling pressure is back.