Exchange Ranking
 Top Exchanges
 24h Volume Ranking
 Popularity Ranking
 Exchange BTC Balance
 Proof of Reserves
 Decentralized Exchanges
 Funding Rate
 Funding Heatmap
 Liquidation Data
 Max Pain
 Long/Short Ratio
 Whale L/S Ratio
 Binance/Okex/Huobi L/S
 Bitfinex Margin L/S
 ETF Tracker
 Solana ETF
 XRP ETF
 Hong Kong ETF
 Bitcoin Treasuries
 Crypto Reversal
 Ethereum Reserves
 HyperLiquid Wallet Analysis
 Hyperliquid Whale Watch
 Large Transactions
 On-chain Movement
 Bitcoin ROI
 Stablecoin Market Cap
 Options Analysis
 News
News Articles
 Economic Calendar
 Features
 Wallet
 Contract Calculator


 Security
 Collections
 Watchlist
 Following
 BNB
BNB  ETH
ETH  SOL
SOL TLDR:Table of ContentsToggle
TLDR:
Solana price forecast supported by tokenized stocks
SOL price chart focuses on key Fibonacci levels
Solana price forecast brings the $114 to $116 range into view as SOL holds on to the $95.13 Fibonacci level and challenges resistance near $100.
Solana controls $75.4 million in tokenized stock DeFi deposits, accounting for 64.5% of the Token Terminal tracking market.
Solana attracted US$263 million in real-world asset (RWA) inflows in 30 days, while Ethereum recorded US$337 million outflows over the same period.
The weekly Elliot wave chart depicts a path that may rebound back to US$160 to US$180, but this pattern will expire if it clearly breaks below recent lows.
Solana traded close to $95 after bouncing back from the $60 zone, and new tokenization data strengthened its online narrative. Solana price forecasts now combine a 26% weekly increase with increased use of tokenized stocks in decentralized finance.
Token Terminal data shows that Solana-related DeFi deposits are US$75.4 million, accounting for 64.5% of the tracked market. Ethereum, BNB Chain and Base followed closely. SOL still faces direct resistance around $99 to $100. However, its stronger on-chain activity provides traders with fundamental signals beyond a technical rebound. Support at $95.13 now separates the consolidation area from a possible deeper correction in the next few trading days. 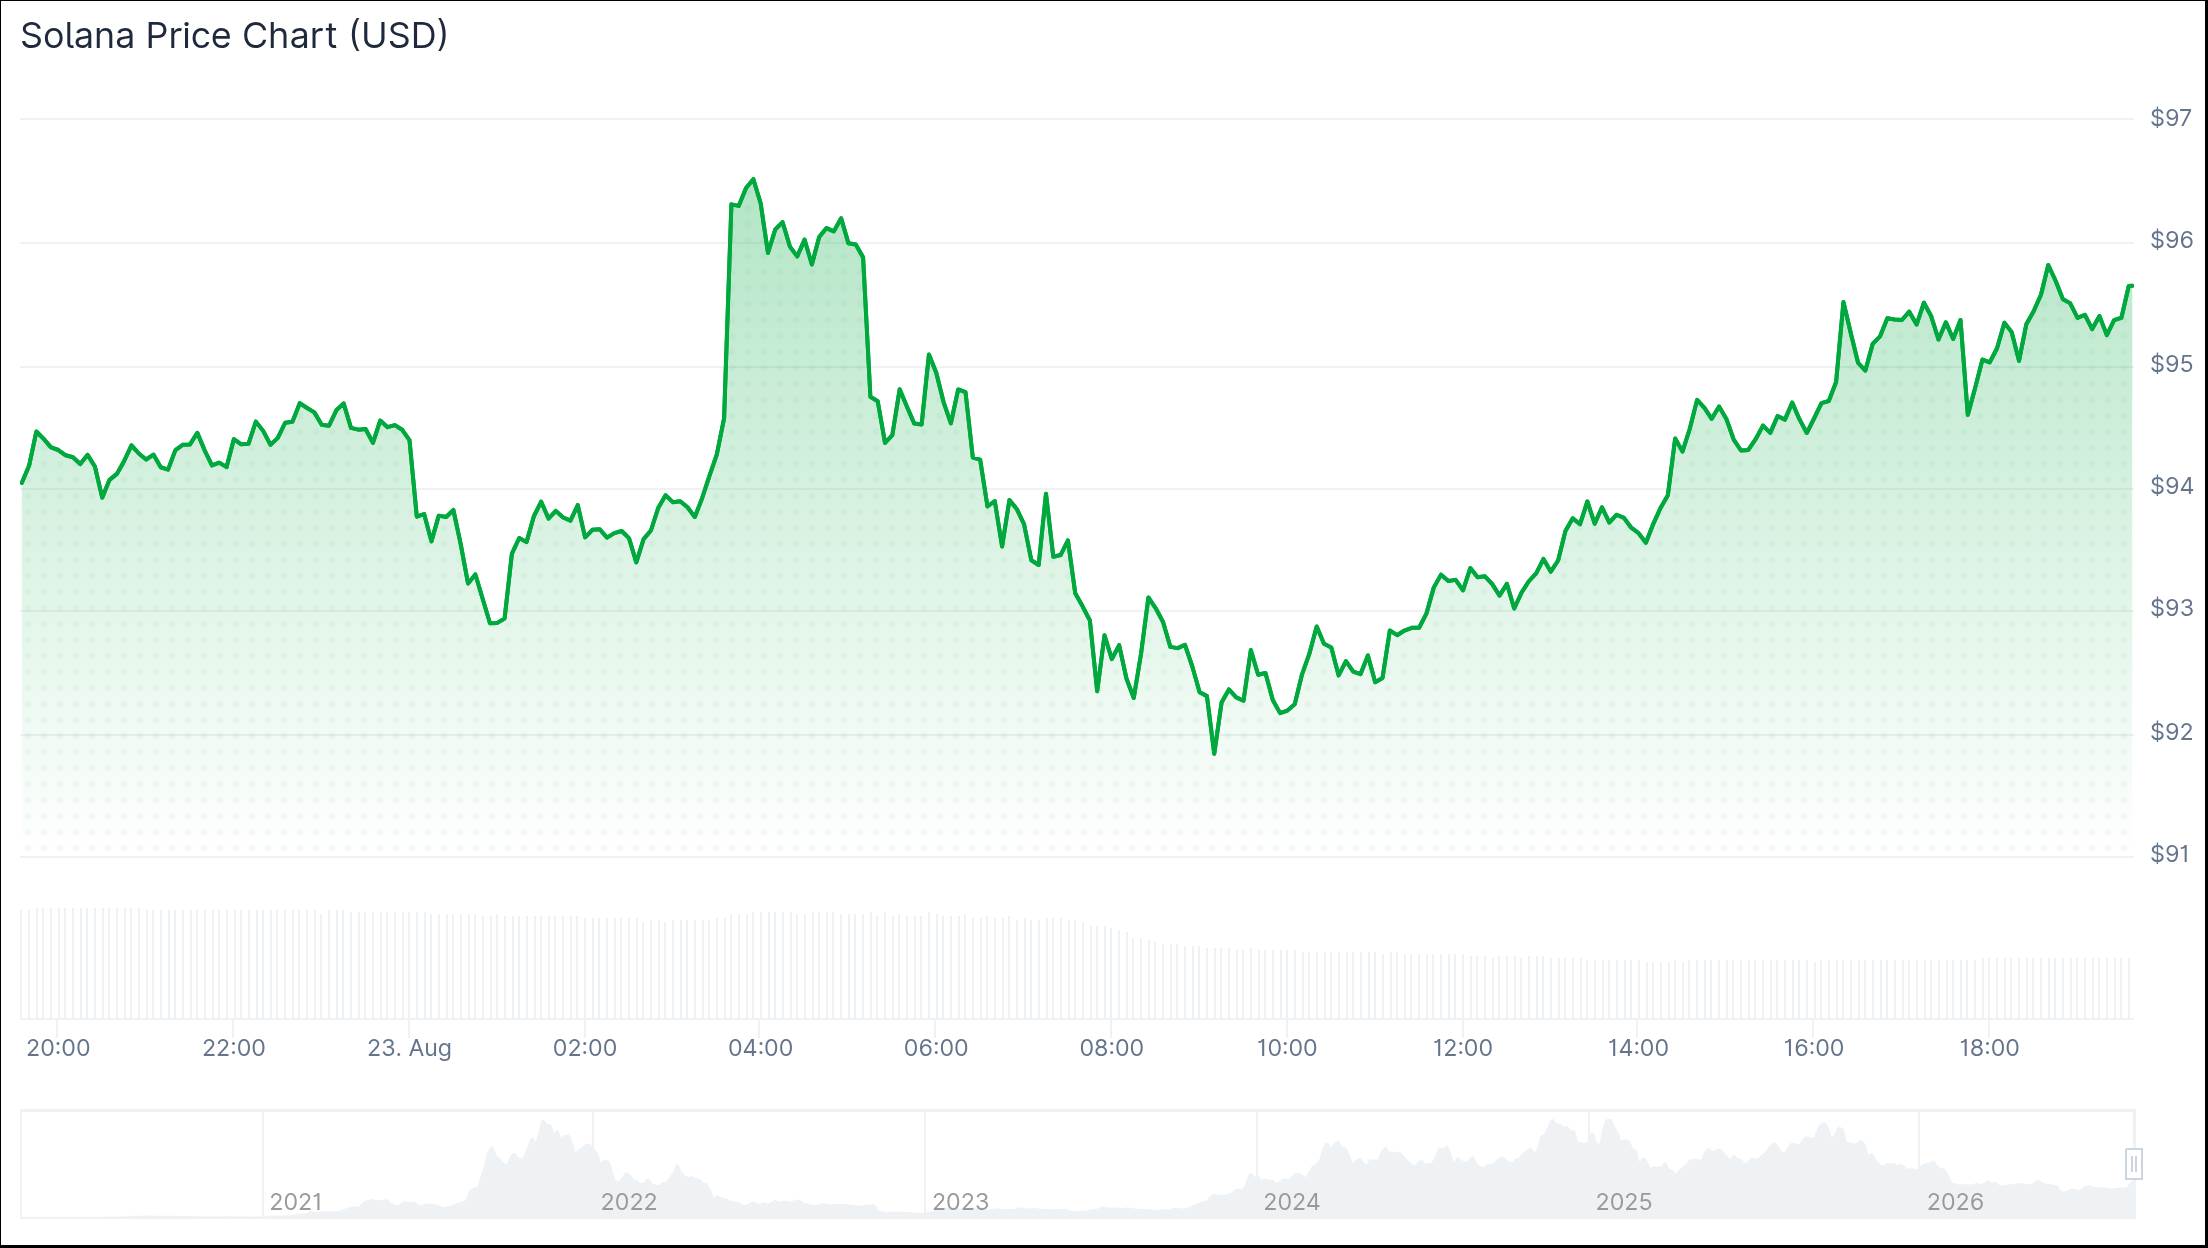
Solana SOL Price
Solana Price Forecast Supported by Tokenized Stocks
The latest deposit data shows that tokenized stocks have moved beyond the issuance stage and entered the lending, liquidity and collateral markets. This shift is significant because assets become more useful when holders can deploy them in DeFi.
Solana's low fees and fast settlements support frequent transfers, small positions and continuous trading.
The broader real-world asset markets reinforce this model. In the 30 days ending August 19, Solana attracted $263 million. During the same period, Ethereum recorded an outflow of US$337 million. This contrasting flow of funds generated $600 million in fluctuations, although it did not prove direct migration between networks.
As of August 19, Solana's RWA value reached US$3.8 billion, exceeding US$4 billion four days later. Ethereum still holds approximately $17.2 billion, a larger base. Solana grew by 10.6% in 30 days, while Ethereum grew by 1.3%. This strengthens Solana's price forecast, but does not guarantee that the token will appreciate.
Tokenized treasury bonds provide another source of growth. During this period, its value on Solana increased by 16.1% to $1.2 billion. Treasury bonds can be used as cash management tools and collateral for institutions. A deeper pool of funds can attract larger deals and make the network more attractive to asset managers.
Source: Token Terminal data
Tokenized stocks also generated $5.8 billion in spot DEX trading volume in the second quarter. Solana handles approximately 95% of global chain equity DEX activity. This concentration supports the network's competitive position, but activity does not automatically flow to SOL holders.
The protocol burns approximately 650 SOLs per day and releases nearly 60,000 SOLs simultaneously. As a result, expense destruction only offset about 1% of new circulation. Without a fixed supply cap, stronger use of tokenized assets may not immediately create scarcity. Solana price forecasts still rely on the market's need to absorb these supplies.
SOL price chart focuses on key Fibonacci levels
SOL prices are currently trading around the 23.6% Fibonacci retracement level of US$95.13. More Crypto Online marks the current structure as the fourth wave adjustment after rising from above the $70 range. Holding that level will maintain the short-term bullish count, although the adjustment may be extended.
$SOL Solana is still consolidating in the fourth wave. Micro support is still being held. -- More Crypto Online (@Morecryptoonl) August 23, 2026
A break below $95.13 may expose a 38.2% retracement level of $90.69. The 50% level of US$87.26 constitutes the next support level. These prices delineate a broader area where buyers may defend a rally. Losing these positions would weaken current Solana price forecasts and increase downside risks.
The first upside test was between $99 and $100. Continued breakthroughs in this range will indicate that buyers have absorbed the pullback. More Crypto Online depicts a fifth wave of gains that could advance towards $114 to $116. This goal is still conditional on holding the support level and breaking through the resistance level.
Rod's weekly chart shows a broader recovery scenario. It views the decline from its 2025 high as an A-B-C adjustment completed around $60. Based on this count, SOL prices could form higher lows and then target towards $160 to $180. But first we must recover $100 and break through the $120 to $140 area.
If the recent adjusted low is clearly broken below, Solana price forecasts will expire regardless of the chart. Elliott Wave Count may change as new price data changes pattern. Traders are looking at $95.13 and $100 for short-term confirmation. Rod's weekly setting uses recent adjusted lows in the $60 area as its failure level.