Exchange Ranking
 Top Exchanges
 24h Volume Ranking
 Popularity Ranking
 Exchange BTC Balance
 Proof of Reserves
 Decentralized Exchanges
 Funding Rate
 Funding Heatmap
 Liquidation Data
 Max Pain
 Long/Short Ratio
 Whale L/S Ratio
 Binance/Okex/Huobi L/S
 Bitfinex Margin L/S
 ETF Tracker
 Solana ETF
 XRP ETF
 Hong Kong ETF
 Bitcoin Treasuries
 Crypto Reversal
 Ethereum Reserves
 HyperLiquid Wallet Analysis
 Hyperliquid Whale Watch
 Large Transactions
 On-chain Movement
 Bitcoin ROI
 Stablecoin Market Cap
 Options Analysis
 News
 Articles
 Economic Calendar
 Features
 Wallet
 Contract Calculator


 Security
 Collections
 Watchlist
 Following
 TRX
TLDR:目录
TLDR:
- 单日存款推动周净流入
- 资金流向与后续收益无明显关联
- TRX价格走势与技术位
单日存款推动周净流入
10月1日,币安TRX净流量达到+7980万枚,创下99天内的最大单日净流入纪录。当日流入总量为1.369亿枚TRX,是30日均值4440万枚的3.1倍。TRX当日收盘价为0.33美元,下跌0.79%。这一激增发生在10月2日非农就业数据(NFP)发布的前一天。根据涵盖6月27日至10月3日的数据集,10月1日并无计划中的宏观经济事件。
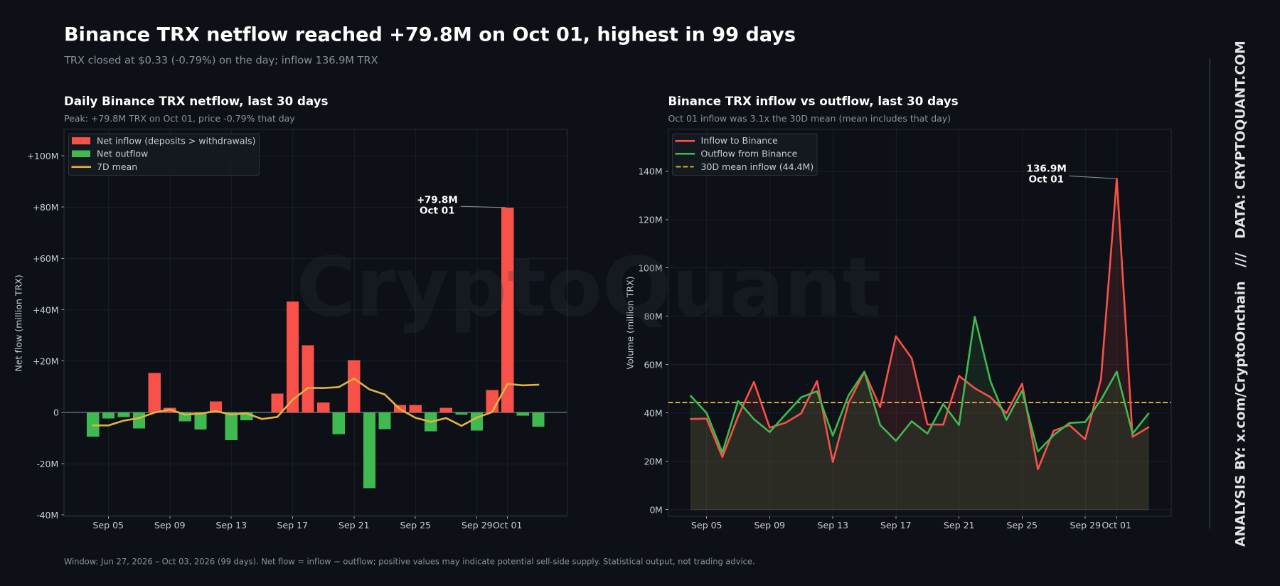
来源:Cryptoquant
尽管七日币安TRX净流量为+7530万枚,较前七日的-2590万有所改善,但仅10月1日当天的流入量就超过了此前一周的总和。其余六天的合计净流出量为450万枚TRX。同样地,14日净流量为+4940万枚,但若剔除10月1日的数据,则转为-3040万枚。这种模式表明,此次激增支撑了整个周的读数。
10月1日累计净流量为3770万枚。随后在10月3日降至3540万枚。因此,正是这例外的一天解释了币安TRX的周净流量,而非持续的流入趋势。
资金流向与后续收益无明显关联
In the 99-day sample, the correlation coefficient between Binance TRX net flow and the current day's yield is +0.62. At the same time, the correlation with the yield the next day and two days later was-0.05 and +0.19, respectively. Only that day's readings showed a significant relationship.
These readings suggest that there is no clear forecast relationship between capital flows and subsequent earnings. Despite the previous surge in deposits, TRX prices fell only 0.04% on the day non-agricultural data was released. The latest inflation data in the data set showed that the consumer price index (CPI) rose 3.4% year-on-year in August, with the core CPI at 2.4%, and the producer price index (PPI) rising 5.4% year-on-year.
Position adjustments by some large depositors ahead of non-agricultural data may be one explanation, but this has not yet been confirmed. More trading periods are needed to confirm whether Binance TRX's net flow trend continues or whether the event is just an isolated transfer. The dataset marked 17 days as "unclean network", resulting in blank network-side indicators. This inspection has been passed in the last 14 days. Two of the last 30 days have been marked with "giant whale anomaly".
TRX Price Trend and Technical Levels
According to market data, TRX is trading at US$0.3357. Prices rose 0.10% in 24 hours and 0.46% in seven days. At the same time, 24-hour trading volume was approximately US$201.7 million. As a result, price volatility remains in the middle of the reporting range.
Analyst Crypto With Gopal released an analysis of the 4-hour chart on the X platform on October 3. He pointed out that TRX is consolidating in a rectangular pattern around $0.335. Resistance is around $0.35 and support is around $0.322.
$TRX is consolidating in a clear rectangular pattern on the 4-hour chart.
prices are around $0.335, with strong resistance around $0.35 and support around $0.322. This range has been maintained for several weeks, showing a fierce game between buyers and sellers.
Breakthroughs above US$0.35 may open... pic.twitter.com/w5cYrexGwR- Crypto With Gopal (@cryptowithgopal) October 3, 2026
According to the content of the post, this range has been maintained for several weeks. If it breaks above US$0.35, the upside target may point near US$0.38. Conversely, if it falls below $0.322, the focus may shift to $0.29. The post defines market sentiment as "focusing on breakthroughs."