Exchange Ranking
 Top Exchanges
 24h Volume Ranking
 Popularity Ranking
 Exchange BTC Balance
 Proof of Reserves
 Decentralized Exchanges
 Funding Rate
 Funding Heatmap
 Liquidation Data
 Max Pain
 Long/Short Ratio
 Whale L/S Ratio
 Binance/Okex/Huobi L/S
 Bitfinex Margin L/S
 ETF Tracker
 Solana ETF
 XRP ETF
 Hong Kong ETF
 Bitcoin Treasuries
 Crypto Reversal
 Ethereum Reserves
 HyperLiquid Wallet Analysis
 Hyperliquid Whale Watch
 Large Transactions
 On-chain Movement
 Bitcoin ROI
 Stablecoin Market Cap
 Options Analysis
 News
 Articles
 Economic Calendar
 Features
 Wallet
 Contract Calculator


 Security
 Collections
 Watchlist
 Following
 SUI
The SUI remained around US$1.20 after rebounding in September, and the US$1.23 -1.25 region constitutes the next level of resistance.
Analysts remain divided on whether the SUI has achieved a breakthrough. Michael van de Poppe believes the SUI has returned to its volatile range. Both the RSI and MACD indicators show weakening momentum, while US$1.10 is a key support level and a break below may drop further to US$1.00.
SUI's gains have slowed down after a sharp rise in September.
After a strong rise in September, SUI's price is currently stable at around US$1.20, but the market has mixed opinions on whether it will confirm a breakthrough trend. CryptoBullet pointed out that this is the strongest monthly closing price since December 2025 and the highest monthly volume since November 2024. However, Michael van de Poppe said SUI remained within its established range in recent transactions.
On the 4-hour chart, the latest K-line price of SUI closed at US$1.1931, an increase of 0.36%. The K-line opened at US$1.1888, hitting a high of US$1.1981, reaching a low of US$1.1817, and finally closing at US$1.1931. The rally started in the $0.70-$0.75 range in mid-September, then broke through the $0.80,$0.90 and $1.00 barriers and reached the $1.20-$1.25 range around September 27 - 28. Since then, SUI has been sideways consolidating between $1.10 and $1.20. Thus,$1.20 remains the current psychological resistance level, while $1.23-$1.25 constitutes the next barrier.
Analysts point to different price targets
CryptoBullet said SUI's monthly closing price has reached its highest level since December 2025. He also noted that monthly trading volume also reached its highest level since November 2024. According to CryptoBullet analysis, it would be an ideal opportunity for the price to pull back to the US$0.90-US$1.00 range, but he also stressed that this is not inevitable. He expects SUI to hit a new all-time high. However, Michael van de Poppe believes that SUI has returned to its trading range and has not shown a clear breakthrough signal, calling on investors to be patient. 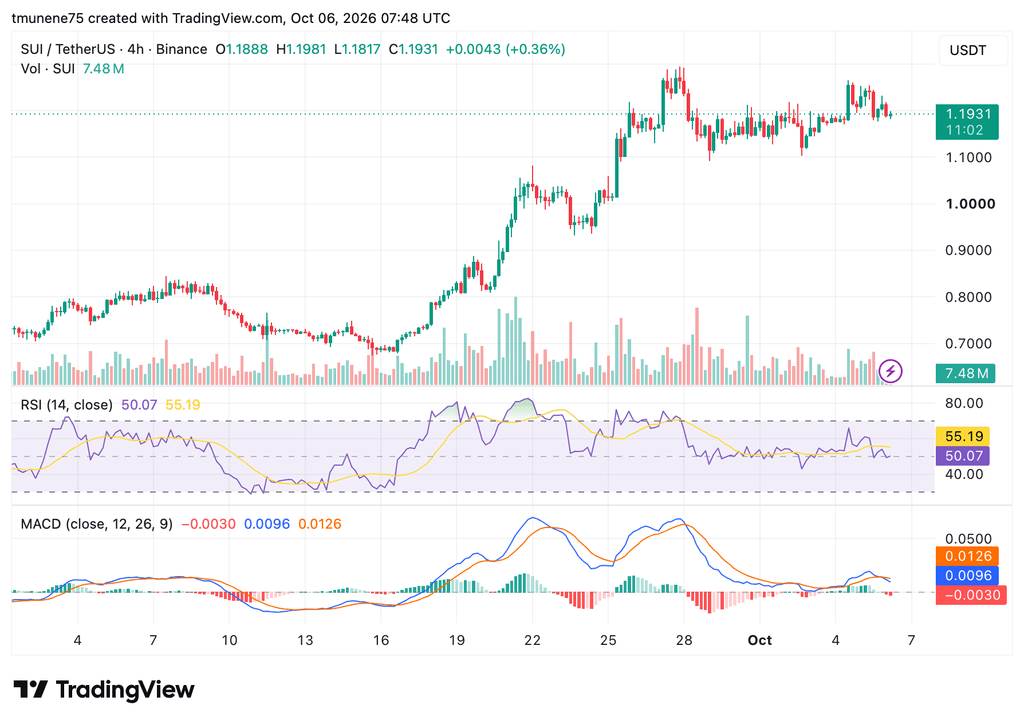 Source: TradingView
Kinetic energy divergence around US$1.20
During the rising period from September 18 to 28, trading volume increased significantly. The current trading volume is approximately 7.48 million SUIs, which is lower than the peak level of the biggest gains in previous rounds. At the same time, the RSI index was 50.07, below its average of 55.19. The MACD line is at 0.0096, which is lower than the signal line of 0.0126, and the histogram value is-0.0030, indicating a weakening of short-term momentum.
If it can effectively break through US$1.20, the price will be exposed to the US$1.23-US$1.25 resistance zone; while US$1.10 is the current direct support level. A break below $1.10 could trigger a correction towards $1.00.